All posts by Mike

How Much Safer are Vehicles that Pass the Updated IIHS Side Impact Test?

Side impact crashes are the most deadly per mph of impact speed; we need better tests to better evaluate our risks.

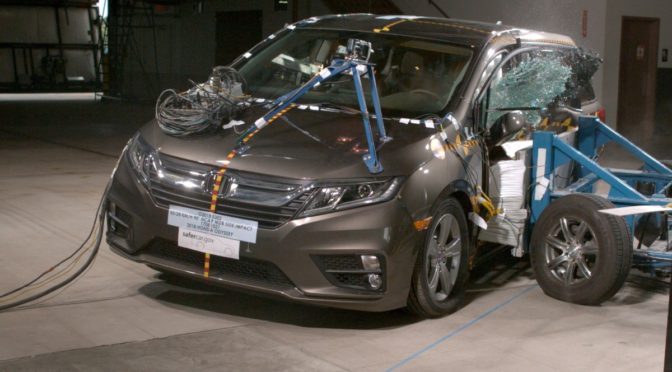
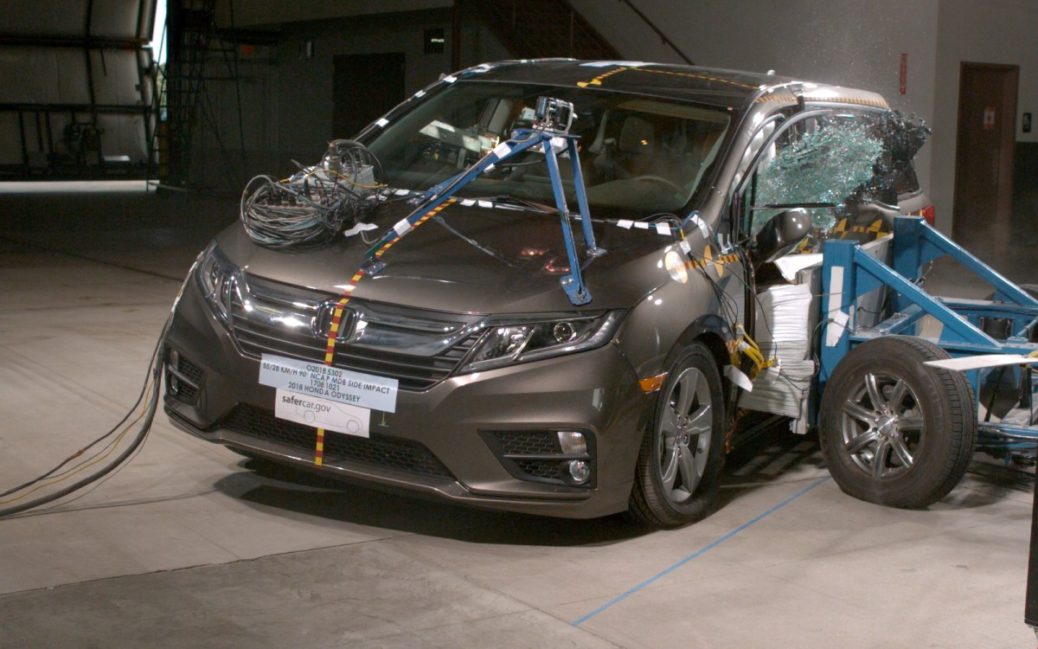
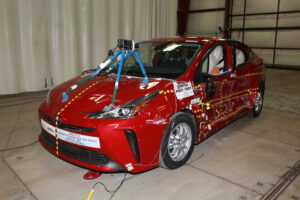
A few years ago, I wrote about how the IIHS had begun to design a replacement side impact test to address some of the shortcomings I’d identified in the original test. In particular, I hypothesized that the IIHS’ threshold for a “good” level of structural impact resistance–at least 12.5 cm of space between the B-pillar and the centerline of the driver’s seat after impact with a 3300 lb barrier traveling at 31 mph–was not enough to keep occupants safe. I based my hypothesis on the various case studies I’d profiled involving frontal and side impacts as well as on calculations of kinetic energy changes across impact speeds (for example, the fact that a head-on crash at 55 mph is the equivalent of being pushed out of the 10th floor of a building).

My theories led me to write a range of articles illustrating the leaders in side impact resistance across vehicular classes, from small- and mid-sized cars to station wagons to minivans to SUVs. As the years progressed, the centerline distance increased with each generation of vehicles tested by the IIHS, reflecting improvements in engineering in new vehicles throughout the country and greater attention paid to side impact safety. I’m happy to say that the day has arrived!

The IIHS modified their side impact test in late 2021 as they acknowledged that high speed side impact crashes still caused a significant number of fatalities in vehicles with “good” side impact scores. What were the changes, and how much of a difference are they likely to make? We’ll take a dive into these questions below, and as usual, the emphasis will be on best practices, and not simply on a blind trust that institutional standards are good enough, because as we’ve learned through decades of public health failures (leaded gasoline, CFCs, asbestos, auto safety, opioids, climate change, and most recently, the COVID-19 pandemic), institutional standards are almost never where they need to be.

What changes did the IIHS make to their side impact crash test?

The main changes the IIHS made to the side impact protocol involved barrier mass, velocity, height, and contact surface. Two of these changes were good. Two of these changes were not necessarily good ones.

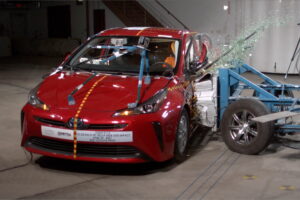
The barrier mass change was a good one; the weight was increased from 3,300 pounds, or that of a mid-sized car or small SUV, to 4,200 pounds, or that of a large car, mid-sized SUV, or minivan.

The velocity change was a good one; the barrier contact speed was increased from 31 mph to 37 mph.

The contact surface change was not a good one in my books. Per the IIHS; it was softened in order to permit it to bend around the B-pillar in order to compromise occupant space by the front and rear doors despite the presence of a strong B pillar. However, when discussing the limitations of the original side impact test, the IIHS also directly admitted that in real-world crashes, vehicles of a given weight produced more damage due to less forgiving (read: stiffer) fronts than the deformable barrier, which acted somewhat like a pillow when impacting the tested vehicles.

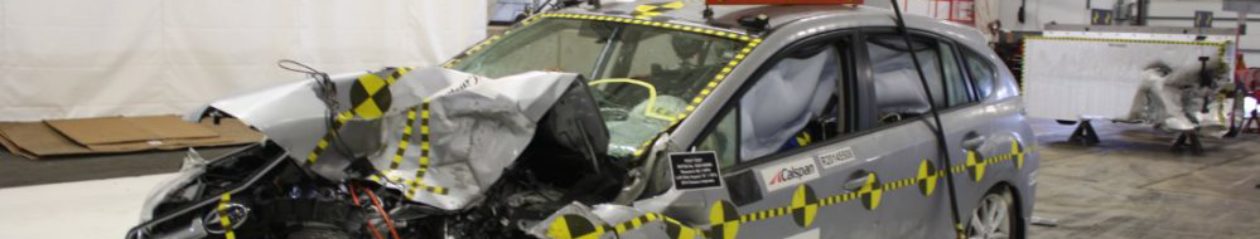
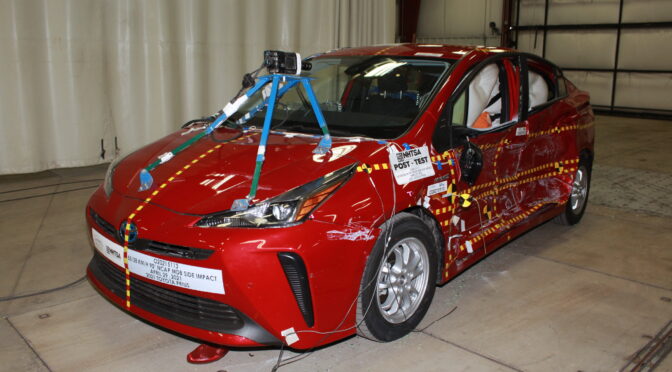
The increased danger of rigid barriers is highlighted well in the NHTSA side pole test, in which a vehicle is driven sideways at a 75 degree angle and at 20 mph into a rigid pole 10 inches in diameter; this is designed to simulate a telephone pole or tree strike.  While the IIHS claims that their original and side tests result in more damage than this test, I completely disagree, and find both tests complement each other. The NHTSA test is a frightening one, as the intrusion is tremendous despite the relatively low speed; it is easy to see how such a crash could and would result in fatal cranial trauma despite the low speeds, and it provides all the evidence necessary that rigid barriers, pound for pound, are far more threatening than deformable ones.

Similarly, the height change was not a good one in my books. The IIHS lowered the height of the barrier under the argument that a lower barrier would better replicate the damage of an SUV strike than that of the prior barrier. I’m not a fan of it because it reduces strain on the B pillar and threats to driver’s heads (as represented by HIC-15 forces) by concentrating striking forces closer to the ground where the vehicle is stronger, rather than toward the cabin, where everything we value is located.

How do IIHS side impact crash test changes translate to real world safety differences?

This is where things get interesting; we’ve seen the science, but now we need the engineering. When I wrote about the limitations of the original IIHS side impact test, my wish list included a 4,000 pound barrier and a 40 mph impact speed. I got a little of both; the barrier mass exceeded my expectations but the impact speed fell below them. Unfortunately for us, the impact speed matters more. Let’s look at the math.

To calculate the test forces, we’ll use kinetic energy = 1 / 2 * mass * velocity * velocity.

The original test featured k = .5 * 1497 kg * 13.9 m/s * 13.9 m/s, or 143.7 kJ, or kilojoules of energy.

Per the IIHS, real world studies indicate that drivers of vehicles with “good” scores on the original test are 70% less likely to die from direct side impacts vs drivers of “poor”-rated vehicles. This advantage drops to 64% with “acceptable” vehicles and 49% with “marginal” vehicles. These are, frankly speaking, great advantages. But where are we going now?

My wish list test of 4,000 pounds and 40 mph results in 290.1 kJ. This is 202% as much force as that in the original IIHS test, or 102% more.

The new IIHS test at 4,200 pounds and 37 mph results in 260.6 kJ. This is 181% as much force as that in the original IIHS test, or 81% more. The IIHS lists it as 82% more, so we’re in the same range.

However, notice the difference between my wish list and their revision: although they added more weight than I was hoping for, the fact that they only boosted speed by 6 mph instead of my 9 mph to hit an even 40 mph means a test that’s significantly less impactful, if you’ll excuse the pun. As we’ve discussed over and over and over again, speed matters more than almost anything else. A 4,000 pound vehicle traveling at 40 mph will do significantly more damage than a 4,200 pound vehicle traveling at 37 mph.

That said, it’s still worth celebrating that the IIHS is using a test that’s more reflective of real world crashes. It is significant (and disappointing), however, that they chose a lower speed to give car manufacturers an easier time to meet the new standard instead of pushing them to do more and save more lives by putting more effort into high end engineering. Forty miles per hour is a natural testing speed upgrade; it’s what the IIHS uses universally in frontal crashes. The main reason to avoid using such a speed in side crashes is because it’s much harder to engineer a vehicle that will let you walk away from a 40 mph side impact than it is to engineer one that will do the same with a 40 mph frontal crash, as there is far less space between the driver and the barrier in a side impact crash than there is in a frontal crash.

Is it worth buying a vehicle tested under the new standard if I already have a “good” vehicle under the old side impact test?

This is perhaps the most difficult question of all to answer. It really depends on your risk tolerances and budget. Personally, if I had a vehicle that already tested well on the original IIHS test, I would not rush to upgrade in order to get the newer technology. It’s absolutely an improvement, but if you’ve got a vehicle with “good” scores on the old test, you almost certainly have a vehicle that has the other essential elements in vehicular safety: good frontal scores and ESC. If you’ve got these, your vehicle is good enough, and you’ll get far more out of focusing on how you’re driving and on where you’re driving. These are the main factors in whether or not you make it home, especially once you have a decent vehicle.

If you find my information on best practices in car and car seat safety helpful, you can buy my books here or do your shopping through this Amazon link. Canadians can shop here for Canadian purchases.  It costs nothing extra to do so, but when you shop through my links, a small portion of your purchase, regardless of what you buy, will go toward the maintenance of The Car Crash Detective.

Small Car Safety: A Nissan Leaf is as Safe as a Nissan Pathfinder, Per IIHS Death Rates

Per the IIHS' 2023 driver death rate math, a Nissan Leaf is just as safe as a Pathfinder / QX60 when it comes to staying alive.
Per the IIHS’ 2023 driver death rate math, a Nissan Leaf is just as safe as a Pathfinder / QX60 when it comes to staying alive.

The Nissan Leaf is one of my favorite electric cars on the market due to its affordability and functionality. As car technology continues to improve, I’m happy to note that it is no longer necessary to choose between one’s safety and one’s wallet; these days, you get to keep both. I’ve written about the Leaf’s 3-across combinations here, and it can absolutely be used to haul a family of five around town and beyond without burning gasoline.

On the other hand, many families might opt for the much larger Nissan Pathfinder (or its badge twin, the Infiniti QX60. Both are midsized SUVs and both have their place, although most families would likely be able to meet much of their goals in the Leaf instead of in the Pathfinder or QX60. Many families, especially those with a safety bent, might automatically dismiss the Leaf for the Pathfinder in the mistaken belief that the Pathfinder / QX60 will be the safer choice due to its much larger size and heft–the 2014-2017 Leaf weighs around 3,300 pounds while the 2015-2020 Pathfinder typically clocks in at around 4,400 pounds. However, long time readers will note that I’ve written extensively about how the way we drive and where we drive are far more important factors in determining whether we make it home at the end of the day than what we’re driving once we’re past basic safety standards, and the IIHS continues to support this idea through their latest batch of driver death rate data. According to their sampling from the NHTSA’s Fatality Analysis Reporting System, or FARS, all three vehicles–the small electric Leaf car, the midsized Pathfinder SUV, and the midsized luxury QX60 SUV–are equally capable of keeping their drivers alive.

How do we know this? It comes from IIHS calculations on driver death rates for recently sold (2014-2017) vehicles in the US. While the calculations still fall prey to large confidence intervals and still fail to consier two of the three most meaningful factors in auto safety–how we’re driving and what we’re driving–they still provide information worth considering. This is the newest IIHS driver death rate report and it comes from the May, 28, 2020 Status Report (Volume 55, Number 2). I wrote a batch of these articles when the last report was released, and it’s already that time to write some more. I’ve previously covered the Leaf’s safety as a small vehicle here in comparison to a Prius and Volt and here in comparison to large SUVs and pickup trucks; the story will not be too different here, as the best practices described above continue to apply. Today we’ll take a look at three offerings from NIssan: the Leaf, the Pathfinder, and the QX60, which technically is an Infiniti but is still a Nissan underneath, in order to figure out whether there’s any safety advantage to putting your family in any of the three over the others.

2014-2017 Nissan Leaf – 5 driver deaths (0-14)

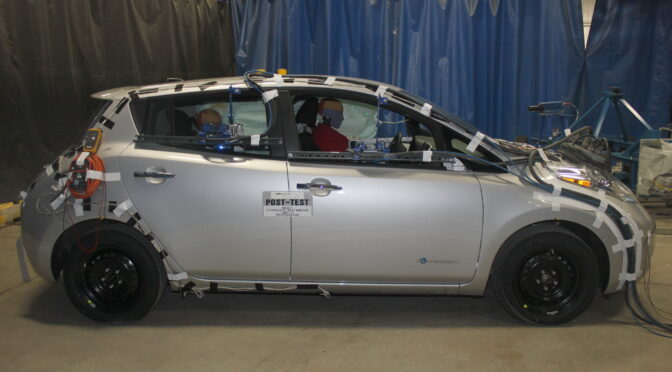
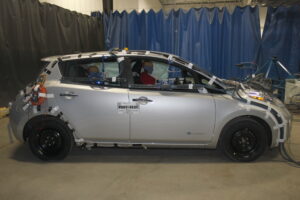
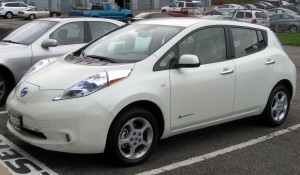
According to the IIHS report, the Nissan Leaf, a small electric car, had a driver death rate of 5 in the 2014-2017 model years, with five predicted fatalities occurring from single vehicle crashes and none from multiple vehicle crashes. These predictions were based on an exposure of 164,259 registered vehicle years and a 95% confidence bound of 0-14.

This doesn’t mean that 5 drivers died driving Nissan Leafs of the aforementioned model years between 2015 and 2018, the surveyed years in the study. Instead it means that the IIHS made a model incorporating NHTSA fatality data on 2014-2017 model year Nissan Leafs and IHS Markit Automotive (now S & P Global Mobility) data on registered Leafs to calculate driver death rates per million registered vehicle years. A registered vehicle year is the equivalent of one registered vehicle being driven for a year. The rates were adjusted for the differing risks posed by drivers by age and gender. Their analysis suggests that, for example, if 1 million drivers drove 1 million of the aforementioned Leafs for a full year in the US, we would expect 5 of them to die over the course of the year.

This is really, really good. It also echoes prior IIHS driver death rate findings for the Leaf, such as when the 2011-2014 Leaf was estimated to have a driver death rate of 8.

2014-2017 Nissan Pathfinder 4WD – 20 driver deaths (3-37)

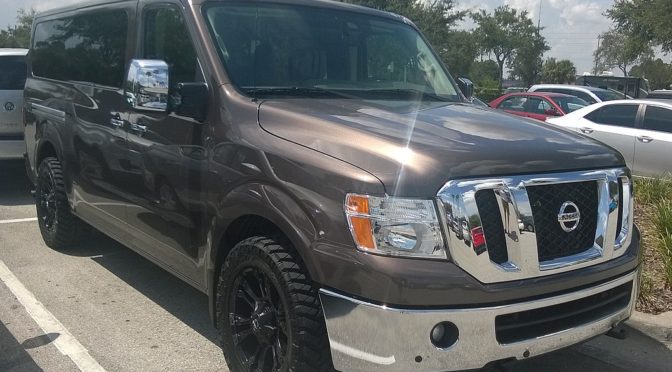
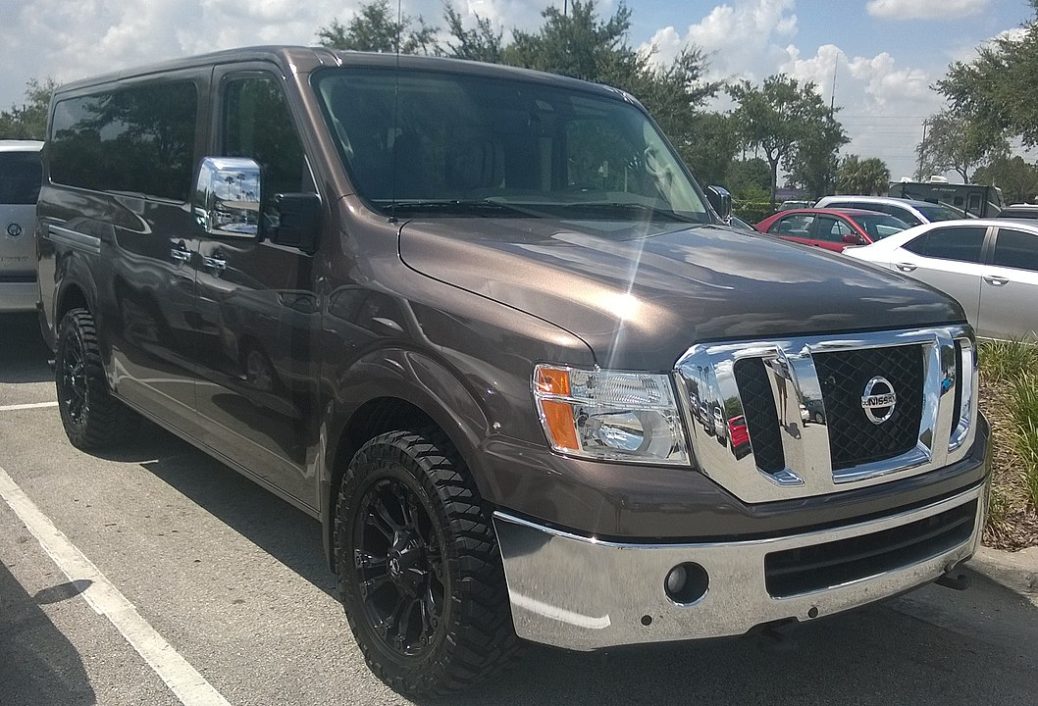
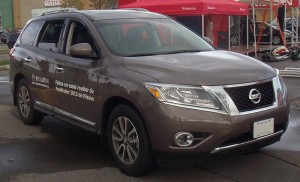
Next we take a look at the 4WD trim level of the 2014-2017 Nissan Pathfinder. The IIHS predicted a driver death rate of 20 between 2015-2018, with 7 predicted fatal multiple vehicle crashes and 14 fatal single vehicle crashes with 12 of them occurring from rollovers. As we’ve seen in a number of other death rate analyses, the crash figures don’t add up to the predicted death rate due to statistical rounding. The exposure came from 450,004 vehicles years with a confidence bound of 3 to 37.

Once again, the general idea here is that if 1 million drivers drove 1 million 4WD Pathfinders around for a year in the US, we’d expect 20 of them to die, with 2/3rds of those fatalities occurring in single vehicle crashes and the vast majority of those occurring from rollovers. These results aren’t linear, but they are proportional. In other words, when fatal crashes occurred in the Pathfinder, they typically were single vehicle crashes and they were almost always due to rollovers when they came from single vehicle crashes.

It’s worth remembering that there is no provable statistical difference between the Pathfinder’s results and those of the Leaf, despite the nominal difference in driver death rates. This is evident because the confidence intervals overlap (0-14 in the Leaf, 3-37 in the 4WD Pathfinder), meaning the true driver death rates of both vehicles could be identical and the predicted driver death rate differences purely due to chance. In the absence of additional data (for example, P values), we cannot conclude that there is a statistical difference in these results.

The 2WD trim had a nearly identical (and again, statistically identical) driver death rate of 25 with a slightly larger confidence bound of 5 to 45 and a correspondingly smaller exposure level of 386,988. Once again, we cannot say the Leaf was statistically safer than the 2WD Pathfinder in the absence of more data, and we definitely can’t say the 4WD Pathfinder was safer than the 2WD Pathfinder due to their massively overlapping confidence intervals. The safest conclusion is that all three vehicles were statistically identical in safety.

2014-2017 Infiniti QX60 2WD – 0 driver deaths (0-26)

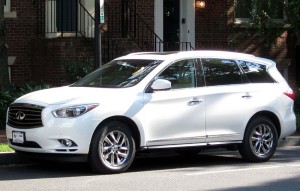
The Infiniti QX60 is essentially the Nissan Pathfinder with additional luxury features. A potential advantage of the QX60, which was formerly known as the JX35, over the Pathfinder, is the inclusion of advanced safety features such as lane departure or blind spot warnings.

Unlike with the Pathfinder, the 2WD QX60 registered a lower driver death rate than its 4WD trim twin. The predicted rate was zero with a 0-26 confidence interval and 144,301 registered vehicle years of exposure.

As was the case with the Pathfinder, there was only a slight difference in driver death rates between the 2WD and  4WD trim levels and it was not statistically significant. The 4WD trim had a predicted driver death rate of 9 with all fatalities occurring from single vehicle crashes and a third of those from rollovers. The exposure was 243,080 registered vehicle years, leading to a tighter confidence interval of 0-20.

It’s worth noting here that the confidence intervals of both trim levels almost completely overlapped; that of the 2WD was smaller because there was more data in terms of more registered vehicle years, reducing uncertainty in the statistical model. Practically speaking again, there was no difference whatsoever in predicted safety across vehicles.

How can the Nissan Leaf be as safe as the Pathfinder or QX60 if the SUVs are so much bigger than the small car?

The Leaf will get your family home, statistically speaking, just as safely as a Pathfinder or QX60 (and with much better mpg).

This is the part where we directly compare all three vehicles and 5 trim levels. Despite the fact that the Pathfinder and QX60 are much longer, wider, taller, and heavier vehicles than the Nissan Leaf, none of them were statistically safer. In other words, the math suggests that you’d be equally safe in any of the three vehicles.

Remember: despite popular belief, your big car, truck, or SUV will not protect you in a highway crash. Vehicular size isn’t nearly as important in most driving conditions as adherence to best practices in driving behaviors and in road selection.

We can’t say there was a difference between any of the vehicles because all of their confidence bounds overlapped, and in some cases, quite heavily.  The 95% confidence bounds tell us where the true driver death rate would be located 95% of the time we looked for it by sampling the cars and drivers (e.g., sampling 1 million drivers driving 1 million Leafs for a year or 2 million drivers driving 2 million Pathfinders for 6 months or 250,000 drivers driving 250,000 QX60s for 4 years, etc).

According to the model, the true driver death rate of the Leaf would almost fall between 0 and 14 while that of the 4WD Pathfinder would almost always land between 3 and 37. The 2WD QX60’s true driver death rate would almost always land between 0 and 26. Statistically speaking, we can’t say any of these vehicles is safer than the other without more data. This applies as well to the 2WD Pathfinder with its 5 to 45 confidence interval and the 4WD QX60 with its 0 to 20 confidence interval. Practically speaking, all four of these vehicles provided the same levels of safety to their drivers.

Is it possible the Nissan Leaf is actually safer than the Pathfinder?

I suspect there’s a chance that there was a significant difference between the Leaf and the Pathfinders since the majorities of their confidence intervals did not overlap; the Leaf only shared 34% of its confidence interval with the 4WD Pathfinder (3-14, or 12 parts of its range vs 3-37, or 35), and only 24% of its confidence interval with the 2WD Pathfinder (5-14, or 10, vs 5 to 45, or 41). However, once again, without additional data, I can’t say that this wasn’t due to chance. And if the difference weren’t due to chance, it would be in favor of the Leaf, meaning Leaf drivers had a lower fatality rate than Pathfinder drivers in the model and calendar years observed.

What about the Pathfinder vs the QX60? Is one safer than the other?

Once again, there was no statistically significant difference between the two that can be declared without additional data. While there were nominal differences in the predicted driver death rates, there were once again significant statistical overlaps in confidence intervals, and the safest conclusion (and most logical one) is that the essentially identical vehicles performed essentially identically in real world conditions. If there actually were a safety difference between the vehicles in the data, I would expect it to come from driver differences–namely that QX60 owners might be more careful drivers due to driving more expensive vehicles or being more educated drivers (who are less likely to engage in risky road behaviors) or being more likely to use seat belts. It’s also possible that the differences, if any existed, could have come from additional safety features in the QX60. However, statistically speaking, both vehicles were likely the same in terms of safety offered.

Does this mean that my husband, wife, kids, or family are just as safe in a Nissan Leaf as they would be in a Pathfinder or QX60 or any other midsized SUV?

According to the IIHS’ math, yes. All three vehicles featured the same core safety features, such as good frontal and side crash scores, side airbags with head protection, and ESC, and I would expect these benefits to extend to passengers in addition to drivers. All of these vehicles are great choices for a family, and I would feel fortunate to have my family in any of them. Once you reach this level of vehicular safety, the difference in whether or not you make it home each day will have far more to do with how you drive and where you drive than what you drive.

In a nutshell, drive at safe speeds, follow best practices with car seats, and choose safe roads.

Following these principles will increase your family’s chances of both avoiding and surviving car crashes to a greater extent than any benefits you’d get from choosing any car you can currently buy or that the IIHS or NHTSA can possibly recommend.

If you find my information on best practices in car and car seat safety helpful, you can buy my books here or do your shopping through this Amazon link. Canadians can shop here for Canadian purchases.  It costs nothing extra to do so, but when you shop through my links, a small portion of your purchase, regardless of what you buy, will go toward the maintenance of The Car Crash Detective.

The Nissan NV Passenger Van (NV3500) Has Never Been Crash Tested by the NHTSA or IIHS

Don’t drive a van that hasn’t been crash tested, lest you become the dummy.

There are a few themes I drive home in nearly every post on the CCD. One involves the need to use best practices the moment you become aware of them, rather than wait for institutions like governments or corporations to acknowledge them. Another has to do with an understanding of what happens when best practices are followed vs what happens when they aren’t due to a lack of knowledge or discipline. A third is perhaps even more fundamental: the need to identify what best practices are, followed by the decision to follow them. This might be the most challenging, as it involves the most detective work as well as the most discipline. However, without it, the other processes don’t matter; you can’t discuss crash scenarios when you have no idea why they occurred or what could have been done differently, and you can’t advocate for best practices if you don’t know what they are.

This brings us to today’s topic: the Nissan NV Passenger Van, or NV3500. It’s one of the most popular choices today in the United States among large families, religious groups, and school and para school functions, along with competing vans like the GMC Savana, Ram ProMaster City, and Ford Transit. However, this is where the cracks start forming in the ice. First, full-sized vans have a spotty safety record. In a country that’s no stranger to avoiding safety mandates, we literally have laws against where such vans can be used as legitimate forms of transportation. Full-sized vans can’t be sold or leased as new vehicles to schools because of how unsafe they’re considered to be compared to school buses unless they include a number of additional features and safety standards under FMVSS regulations that apply to school buses and Multifunction school activity buses, or MFSABs (full-sized or short buses not used for transport during school hours). With that noted, full-sized vans are also less likely to be thoroughly crash tested by our two primary crash testing organizations in the United States, the NHTSA, or National Highway Transportation Safety Administration, and the IIHS, or Insurance Institute for Highway Safety. We can somewhat excuse the IIHS since they’re a private organization, although that does again illustrate the drawbacks of placing public safety issues in the hands of private corporations, but there is no excuse whatsoever for the NHTSA to refrain from testing any full-sized van to the same degree as any other non-bus-sized vehicle intended for public transportation. But that’s where we are right now.

Which crash tests has the NHTSA and IIHS conducted on the NV3500?

As of this writing (February 2020), the NHTSA has never performed a crash test on the Nissan NV Passenger Van, the NV3500. The IIHS has never crash tested the NV3500. In other words, there are no publically available standardized crash tests in the United States for this vehicle that are comparable to crash tests for any other vehicle in the country. To go a step further, the IIHS has never published a standardized crash test for any full-sized van made in the 21st century.

What does this mean?

It means that if you buy an NV3500, you literally have no idea how it will perform in a crash. Yes, it includes ESC, which is great; that’s the biggest development in car safety since frontal and side airbags and the lap and shoulder seat belt. Yes, it includes side curtain airbags. Yes, Nissan says it’s safe. But have you ever heard a car manufacturer say otherwise before public or governmental pressure forced it to? No. The truth is that we don’t know what the NV3500 would do in a full frontal crash, in a moderate overlap crash, in a small overlap crash on the driver’s side, in a small overlap crash on the passenger’s side, or in a side pole crash. We also don’t know how many times its weight it can support, because it’s never been roof crush tested. These are all tests the NHTSA and IIHS peform on nearly every passenger vehicle sold today in the United States. But these test results don’t exist for the NV3500, a van designed to carry 12 people at highway speeds on public roads. It could be a death trap for all we know, because we simply don’t know.

Why is it important to have this information, and how could we get it?

When I write about side impact crush resistance and how the Honda Odyssey is the safest minivan in the country due to a B-pillar crush resistance of 21.5 cm as measured in the IIHS side impact test, that tells you something. You have an idea of exactly where that minivan and that rating stand in comparison to every other minivan sold, as well as every other car or SUV or pickup truck you’re likely to consider. But that number–as well as just about every other safety-based number–is missing when it comes to the NV3500. How much would that B-pillar hold? I have no idea, and you don’t either, because it’s not publically available information.

Could we find out?

Sure, with around $40,000, which is what it would cost to buy an NV3500 and contract a private agency to test it (or buy the equipment to do so yourself). But much like paying for your own heart surgery out of pocket (or sending your spouse to medical school in order to get the job done in-house), that’s beyond the reach of most individuals, which is precisely why we pool risk and huge expenses through governmental programs. In this case, the relevant governmental program would be the NHTSA. In the private sector, it would be the IIHS. However, neither has stepped up to the plate, and since the IIHS is a private institution, it has no legal obligation to do so. Technically, neither does the NHTSA, but it does have a functional and moral obligation to do so, as it is funded entirely by public dollars to serve the public good. And it is negligent to eschew crash testing of vehicles used by private individuals and sold in significant numbers simply due to bureaucracy.

Is there a way to convince the NHTSA to test the NV3500?

Certainly! You can write letters and emails, but this is unlikely to get results, as big organizations don’t listen to little people unless we speak in large enough numbers; Dr. Seuss famously noted as much in Horton Hears a Who! The practical way of getting this done will be if someone famous enough dies in an NV, much as how the FAA is highly likely to mandate TAWS in helicopters after the Calabasas crash involving Kobe Bryant and 8 other victims, despite ignoring NHTSA recommendations for more than 10 years and counting. The problem here is that it might take a lot of little people dying (and most likely will) before a big person does, especially since the big people are more likely to use giant coach buses. Alternatively, if a large number of little people die at once, such as in a crash involving many dead schoolchildren, the public outcry again would likely drive the NHTSA to action. However, since the NHTSA already banned the new sale of such vans for school purposes unless they included school bus-type enhancements, such deaths are unlikely to occur.

In other words, we’re probably going to continue waiting for a while for these results, barring a surprisingly large number of newsworthy deaths involving NV3500s. Which is awful. But that’s how our government tends to work when it comes to road safety.

Does this mean we don’t buy the NV3500 until it’s crash tested?

In my opinion, yes. Don’t reinforce the government’s irresponsibility by purchasing vehicles it refuses to crash test. It’s not your job to be the dummy; there are perfectly good ones out there used each day in crash testing facilities.

It’s also worth keeping in mind that, as noted earlier, no full-sized van currently sold has ever been tested by the IIHS, although the Ford Transit has been tested by the NHTSA in frontal, side, and pole collisions (and has done well). You simply aren’t going to get a complete picture of full-size van safety relative to minivan, car, pickup, or SUV safety right now in the United States.

That said, if you already have an NV3500, this doesn’t mean you have to sell it. As I’ve always noted and continue to do on the CCD, the lion’s share of difference in whether you make it home to your loved ones each night or not isn’t what you drive, but how and where you drive. Focus on those elements and you’ll be safer in an NV than just about anyone you see driving just about anything else on the road.

If you find my information on best practices in car and car seat safety helpful, you can buy my books here or do your shopping through this Amazon link. Canadians can shop here for Canadian purchases.  It costs nothing extra to do so, but when you shop through my links, a small portion of your purchase, regardless of what you buy, will go toward the maintenance of The Car Crash Detective.

3 Across Installations: Which Car Seats Fit a Volvo XC40?

The Volvo XC40 is a small, safe, and luxurious SUV released since the 2018 model year by Volvo Cars. In the United States, it competes with a neverending line of crossovers including the Toyota Rav4, Honda CR-V, Jeep Renegade, Jeep Compass, Nissan Rogue, Mazda CX-5, Subaru Forester, and Ford Escape.  There’s also likely some overlap between families interested in the slightly larger XC60 or station wagon-based V60. It tests well from a safety perspective, with  high safety scores in the small overlap, moderate overlap, side, and roof strength tests, as well as established but essential goodies like ESC and side airbags. Front crash prevention is also included as a standard feature on all trims, marketed as “City Safety”, and is capable of avoiding vehicular collisions at up to 25 mph and crossing pedestrian collisions at up to 12 mph consistently. In other words, it checks off the vehicular safety boxes when looking at best practices. But how does it do with car seats?

I made it my goal to find out. However, as always, before going into which seats fit (an awful lot of them) and which ones didn’t (very few), let’s review which kinds of seats are best for particular developmental ages and stages for your kids, and why.

In my books, the core of car seat safety involves rear-facing. It’s the safest position available in every vehicle, statistically speaking, and the benefits of extended rear-facing extend from childhood through adulthood. I typically suggest keeping children rear-facing as long as possible (until 4 or 5 like the Swedes), followed by harnessing until they can safely use booster seats (until at least 5, like the Swedes), and then boostering until the 5 step test is passed (typically between 10, 11, and 12). Beyond that, I suggest keeping kids in the back seat until at least 13, and delaying teen solo driving until 18 if possible. The goal isn’t to move through seats as quickly as possible; it’s to keep kids as safe as possible whenever they’re in motor vehicles.

If you find my list of what I believe to be the most detailed 3 across guide for the Volvo XC40  on the Internet, you can shop through my Amazon link below. I’ll add more seats as I test or confirm them over time.

You can access the complete 3 across guide for every vehicle here and the complete list of recommended seats here. The Canadian car seat guide is here. 3 across car seat images are taken by yours truly or are courtesy of Wikipedia or the NHTSA.

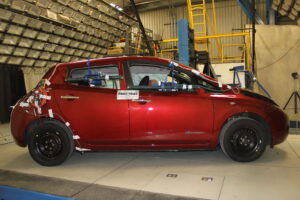
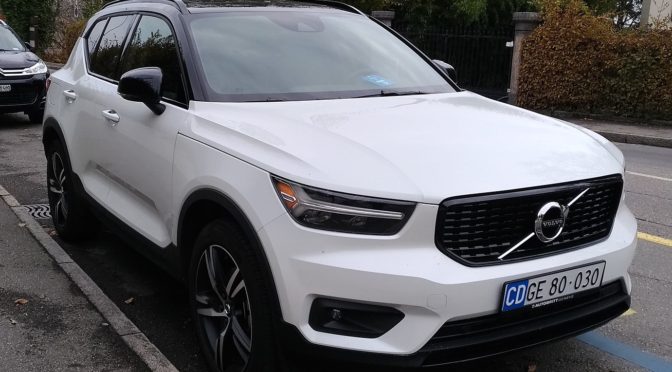
2018, 2019, 2020 Volvo XC40

Guaranteed 3 across installations:

Clek Fllo (x3).

Clek Foonf (x3).

Diono Radian 3RXT (x3).

Diono Radian 3RX (x3).

Clek Oobr (x3).

Diono Radian R100 (x3).

Chicco KeyFit 30 (x3).

Tips and Tricks:

The initial generation of the Volvo XC40 is a shade over 174 inches long, 73.3 inches wide, and 65 inches tall. As a result, you’ll be able to fit narrow seats in the 2nd row as long as you’re willing to use seat belts instead of LATCH. As is almost always the case with small SUVs (which are essentially raised versions of small cars),  front-to-back room will be limited, particularly if you’ve got taller occupants in the front row.

If you find my information on best practices in car and car seat safety helpful, you can buy my books here or do your shopping through this Amazon link. Canadians can shop here for Canadian purchases.  It costs nothing extra to do so, but when you shop through my links, a small portion of your purchase, regardless of what you buy, will go toward the maintenance of The Car Crash Detective.


IIHS Acknowledges Side Impact Test Limitations Identified Years Earlier on CCD

Side impact crashes are often fatal. We need more realistic tests to design more resistant cars.

One of the most consistent messages I’ve tried to share on the CCD since its creation has been for the need to identify best practices and execute them without waiting for institutions to acknowledge them. This is a song and dance we see time and time again, such as in our national approach to car seat safety. The American Association of Pediatrics most recently recommended in 2011 rear-facing children until the age of 2, marking a major increase over the 2002 recommendation of doing so until 1. The problem, of course, is that best practices as outlined in Sweden recommend rear-facing until 4 or 5, and have done so for more than 40 years. In other words, our latest policies in car seat safety are still behind where the Swedes were 40 years ago. This, incidentally, is a major part of why we continue to lose about 5 children to auto trauma in the US for each child lost in Sweden. To follow best practices, you can’t wait for your government to learn they exist, never mind to put them into law. Unfortunately, the knowledge and enforcement falls on you. Let’s look at how this applies today to an area of interest of mine: side impact collisions.

Vehicular safety is only a third of the road safety picture, but it’s still worth talking about

The scene is no different when it comes to vehicular safety. Even though it’s only one third of what actually matters in road-related best practices (along with driving behaviors and road infrastructure, which make far more of a difference than vehicular design), it’s still significant. We know that of the three main types of multi-vehicle collisions–frontal, side, and rear–that side impacts have the most severity and are the most likely, crash for crash, to result in fatalities. This is why nearly every article I’ve written on vehicular safety in multi-vehicle contexts has had to do with the vehicles that have tested best in side impact crash mitigation. The theory I developed some years ago was that, while the IIHS’ threshold for a “good” level of structural impact resistance–at least 12.5 cm of space between the B-pillar and the centerline of the driver’s seat after impact with a 3300 lb barrier traveling at 31 mph–was acceptable, it wasn’t enough. I wrote article after article illustrating the leaders in side impact resistance across vehicular classes, from small- and mid-sized cars to station wagons to minivans to SUVs. Here they are below:

My theories were based on the crashes I’d studied involving side and frontal impacts as well as an understanding of the dramatic increases in kinetic energy present with slightly higher impact speeds (which we’ve also discussed extensively throughout the blog).

What did the IIHS learn about their side impact test?

This is where the IIHS comes in. They noticed (as has anyone paying any amount of attention to crash statistics) that people continue to die in side impact collisions despite increasing market penetration of well-scoring vehicles. While cohesive, long-term solutions would not solely focus on strengthening vehicles but on producing safer drivers and roads that prevented or reduced the risks of side impact collisions, the IIHS, by design, focuses nearly exclusively on vehicle design. On one hand, this severely limits their effectiveness. On the other, every bit of the puzzle helps. This, by the way, is one of the many reasons why it’s so important for them to not hide internal crash data any more than they already do. Here’s what they found:

IIHS researchers conducted another study of real-world side crashes. This time they examined how well each of the test measurements that feed into the ratings correlates with death risk.

The study included 1999-2016 model year passenger vehicles with standard head-protecting side airbags that had been rated by IIHS for side protection. The researchers looked at the rate of driver deaths per left-side crashes for each model. They compared these rates with 10 specific intrusion and dummy injury measures that go into the ratings, finding that each one was correlated with driver death risk in left-side crashes.

For example, the authors estimated that each additional centimeter of B-pillar intrusion was associated with a 3 percent increase in death risk. Each additional millimeter of rib deflection, one of the measures recorded by the dummies in the test, was associated with a 1 percent increase in death risk.

The key part is in blue above. The researchers were simply interested in the validity of the test itself–whether the measures the ratings were based on were related to real-world death risks. They were, but in particular,they also found direct correlations between tested side impact intrusion and risks of death in real-world crashes.

We came to this conclusion several years ago–lower intrusion, greater survival

The annual CCD budget is much smaller than that of the IIHS, as I don’t have an army of insurance companies funding my work. If I did, I’d focus far more on best practices while leaning on the shoulders of giants–Swedish and otherwise–instead of on retesting policies and practices leaders in the field established years ago. However, we are where we are, and the good news is that the IIHS is planning on designing a more stringent test for manufacturers. It’s just worth noting that, as is often the case, you can’t wait for corporations to come to logical conclusions related to public safety and health: if you’ve got access to better information or the ability to generate such information on your own, use it. Share it. By the time the corporations come to the same conclusions, you’ll be around to enjoy them, and more importantly, you’ll have improved the quality of life for a number of people you may never meet but with whom you share this great big world.

What will the IIHS and car manufacturers learn from the new test?

Here’s a look into the future:

If the test is meaningful, most vehicles will fare poorly at first, because it will reflect a more realistic crash environment–the one that leads to all the real world deaths in vehicles with currently good side impact scores. If the test is not meaningful, most vehicles will do well, and we will learn nothing.

This isn’t school. The fact that vehicles pass with flying colors from the start is meaningless if people continue to die in massive numbers. A meaningful test will need to be one that simulates real world conditions. I’d personally like to see a test speed of at least 40 mph–the same speed used in their frontal collision tests–and a vehicular mass of at least 4,000 pounds, which is far more representative of the average SUV, minivan, or pickup on the road than 3,300. They note themselves in a related study that the average 2019 model year SUV weight was 4,200 pounds, which they used in a small series of tests to see if there were differences in how vehicles responded when impacted by real vehicles compared to when they were hit by the test deformable barrier. Incidentally, they discovered there that real vehicles of a given weight produced more damage due to less forgiving (read: stiffer) fronts than the deformable barrier, which acted somewhat like a pillow when impacting the tested vehicles. Clearly, they have more work to do. But the key point to take home regarding the redesigned test is that if it doesn’t represent the types of crashes I write about on the CCD–those at highway speeds with heavy vehicles–it isn’t going to teach us anything or lead to safer vehicles.

Does this mean I need a vehicle that shows up on your lists, Mike?

No, no, no.

Such vehicles are ideal if you can get them, but in the end, this still isn’t what makes the lion’s share of difference in whether you’ll make it home to your loved ones each night. Focus on your driving–how you do it and where you do it. That’s where up to 90% of the results will come from. What you’re driving may make up the last 10%, and I think that’s generous. Remember–in a 70 mph head on collision (whether with another vehicle or with a bridge or home-like barrier), you’re facing 306%, or more than 3 times, the force that your vehicle was designed to protect you from ((70)^2/(40)^2). Statistically speaking, everyone in your car, minivan, SUV, or pickup is going to die. I’ll repeat that once more because it’s such a key point to remember.

No matter what you drive, you won’t survive past a certain collision speed

That speed will vary with a number of factors, but it’s almost always going to be hit by the time you reach 70 mph. It’s often hit at far lower speeds, like at 55 mph. Remember, that’s as severe of a crash as being pushed off a 10th floor parking garage while strapped into your car.

Learn, then follow best practices. Everything else is fluff.

If you find my information on best practices in car and car seat safety helpful, you can buy my books here or do your shopping through this Amazon link. Canadians can shop here for Canadian purchases.  It costs nothing extra to do so, but when you shop through my links, a small portion of your purchase, regardless of what you buy, will go toward the maintenance of The Car Crash Detective.