Tag Archives: norway

Americans Drive More than Anyone Else in the World, And Are Dying For It

How much do you drive? Is there any way you could reduce this amount?
Is there any way you could drive less than you currently do?

One of the most basic, yet most effective, means of reducing our odds of death by auto traffic is to reduce our exposure to said traffic. I’ve written about this before, in terms of how we can double our driving safety by cutting our annual mileage in half. However, the information bears repeating, given the fact that we drive more, on average, in the United States than in any other country on the planet.

I find it helps to have international frames of reference when discussing driver safety, as it often provides us with a greater perspective of how things we take for granted in the US might not necessarily be the safest or even most practical ways of doing things. Today’s article will explore US driving rates across ages and compare them to a number of countries with a focus on Norway, Sweden, and the United Kingdom. We’ll then extrapolate what death rates in each country would look like if each nation adopted the other’s driving habits.

Just how much do Americans drive per year, on average?

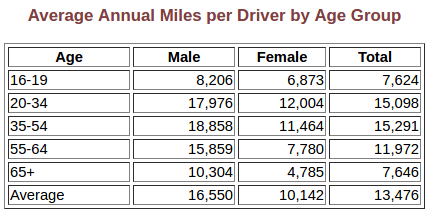
According to the Federal Highway Administration, Americans drive 13,476 miles per year on average. These figures vary significantly by age and gender, with men driving more than women at all stages of life.  The peak driving ages for both genders occur between 35 and 54 for men, with an average just beneath 19,000 miles, and and between 20 and 34 for women, with an average of just over 12,000 miles. On average, then, the typical American drives a shade under 37 miles a day.

Per the IIHS, 35,092 Americans died from auto traffic in 2015, making it the worst year since 2008, where more than 37,000 died. The per capita death rate was 10.9 auto deaths per 100,000 residents, while the death rate per 100 million miles driven was 1.12.

Let’s look at how this compares to the average Norwegian, Swede, and Englishman or woman.

How many miles do Norwegians drive on average?

Per Statistisk Sentralbyra, or Statistics Norway, Norwegians drove an average of 12,289 km in 2015, or 7,636 miles per year. This translates to an average of 21 miles a day, or about 57% of the average US daily mileage.

Per SSB, 117 Norwegians died from auto traffic in 2015, making it the best year since 1948. I’ve written before about how Norway compares very favorably to the United States in auto safety, whether in overall fatalities or in child safety, and this was underscored in 2015. The per capita death rate was 2.2 auto deaths per 100,000 residents, which was one of the lowest in the world.

The 2016 IRTAD road safety report notes the peak fatality figures were reached in 1970 with 560 deaths. The report credits the dramatic drops in death rates since the 70s to a variety of causes, including safer cars, reduced speed limits, introductions of median barriers, and seat belt campaigns, as well as an overall Vision Zero strategy.

How many miles do Swedes drive on average?

Per Transport Analysis, Swedes drove an average of 12,216 km in 2015, or 7,591 miles per year. This translates to an average of just under 21 miles a day, or about 57% of the average US daily mileage.

Per Transport Analysis, 259 Swedes died from auto traffic in 2015. The 2016 IRTAD road safety report notes the peak fatality figures were reached in 1965 and 1966 with 1,313 deaths, and 2015’s figure appears to be Sweden’s lowest in modern history. The report credits the dramatic drops in death rates since the 60s to “safer cars, lower speeds, and the introduction of median barriers” – all elements of Vision Zero.

As with Norway, I’ve written about how Sweden experiences very few deaths, proportionally speaking, to the US, both in terms of overall deaths or in child safety (this is where extended rear-facing was born). In 2015, the per capita death rate was 2.7 auto deaths per 100,000, also one of the lowest in the world.

How many miles do UK citizens drive on average?

Per the UK Government’s Road Use Statistics 2016, the British drove an average of 6,488 miles in what appears to be 2013. This translates to an average of just under 18 miles a day, or about 49% of the average US daily mileage.

Per National Statistics, 1,732 Britons died from auto traffic in 2015, which appears to be the second best year in modern history after 2013, when 1713 died. This figure also represented a 46% drop in 10 years compared to the 3,201 death toll in 2005. The 2016 IRTAD road safety report notes the peak fatality figures were reached in 1941 with 9,000 deaths. In 2015, the per capita death rate was 2.7 auto deaths per 100,000, again one of the lowest in the world.

Interestingly, Sweden and the UK shared the same per capita death rate, indicating that the difference in total road deaths between the two countries could be entirely explained in 2015 due to the difference in total population between the two countries. There were approximately 6 Brits for every Swede, so with an identical death rate, the death toll was 6x higher in the UK than in Sweden.

How do the average miles driven by Americans affect our annual road death toll?

We’ve established that Americans drive more miles per day (and by extension, per year) than Norwegians, Swedes, and Britons, on average. However, the next step in figuring out how our driving patterns–or more specifically, the extent of our driving–affect our annual road death toll. To put the numbers into focus, let’s compare each of the three countries to the US.

If Americans drove as few miles as Norwegians or Swedes (i.e., 21 miles a day, or 57% of 37 miles a day), instead of 35,092 deaths in 2015, we’d have had approximately 20,002 deaths, representing 15,090 lives saved.

If Americans drove as few miles as the British (i.e., 18 miles a day, or 49% of 37 miles a day), instead of 35,092 deaths in 2015, we’d have had approximately 17,195 deaths, representing 17,897 lives saved.

That’s huge.

How would the annual fatality rate in the US change if the per capita death rate were the same as those in Norway, Sweden, or the UK?

Now that we’ve compared how many fewer road deaths the US would suffer annually if we reduced our driving rates to those found in Norway, Sweden, and the UK, let’s compare how the annual fatality rate would change if we shared per capita rates with those countries. This figure is particularly interesting when combined with the changes based on mileage, as the  closer the road death toll from a modified per capita rate is to the road death toll from a modified mileage, the more our mileage (i.e., amount of driving) explains our per capita rate.

To put it simply, if adopting the per capita death rates of other countries wouldn’t give us significantly different annual death tolls than if we simply adopted other countries’ driving frequencies, this suggests the primary problem in the US with respect to road safety is simply how much we’re driving. On the other hand, if the modified road death toll from a modified per capita rate isn’t close to that of a modified road death toll from a modified driving rate, it suggests the US’ road safety issues are primarily due to other factors (e.g., the safety of the road network or the safety of our vehicles). The availability of other transportation options (e.g., buses and trains) also counts as a separate factor that could explain the difference in safety. Let’s see.

If the US shared Norway’s per capita death rate (2.2 instead of 10.9 deaths per 100,000 citizens), instead of 35,092 deaths in 2015, we’d have had approximately 7,083 deaths, representing 28,009 lives saved.

If the US shared Sweden or the UK’s per capita death rate (2.7 instead of 10.9 deaths per 100,000 citizens), instead of 35,092 deaths in 2015, we’d have had approximately 8,693 deaths, representing 26,399 lives saved.
Once again, this is huge.

Which matters more? Reducing driving rates or the overall per capita death rate?

Comparing the projected fatalities from the two types of adjustments (by mileage and by per capita rates) shows much, much bigger drops in total deaths by changing per capita rates than by changing driving rates.
Adopting Norwegian per capita death rates would result in roughly 1/3rd of the deaths we’d have if we simply adopted their driving rates.
Adopting Swedish per capita death rates would result in fewer than 1/2 of the deaths we’d have if we simply adopted their driving rates.
Adopting British per capita death rates would result in just over 1/2 of the deaths we’d have if we simply adopted their driving rates.
As a result, it looks like the primary reasons for much greater safety results in the leading countries as compared to the US cannot simply be explained by the fact that they drive less (although that explanation is the leading factor in the UK-US comparison). There are a range of other factors at work, including an overall pattern of safer driving habits, safer vehicle options, a safer road network, and more public transportation alternatives.
However, does this meant that it’s not worth driving less? Absolutely not. The fact is that we could immediately chop off 43-51% of our annual road death toll simply by committing to drive at roughly half our current rates. This applies at the national, state, local, and personal level. The majority of the difference in death tolls cannot be explained primarily by driving rates, but driving rates remain one of the largest factors in affecting that difference.
Advocate for safer road systems, for public transportation. Advocate for safer vehicles and for safer driving practices. However, in the mean time, drive less, and encourage your loved ones to do the same. It’s quite possibly the single most effective driving technique you can master.
If you find my information on best practices in car and car seat safety helpful, you can buy my books here or do your shopping through this Amazon linkCanadians can shop here for Canadian purchases. Have a question or want to discuss best practices? Send me an email at carcrashdetective [at] gmail [dot] com.

Why Are Norwegian Drivers Safer Drivers Than Americans?

Drivers in Norway are safer than those in the US. Let's unpack way.
Drivers in Norway are safer than those in the US. Let’s unpack why.

This is part of an ongoing series in lessons on international perspectives in driving safety and culture. My goal is to shed light for American audiences on how the leading countries in auto safety (as measured by the lowest death rates per capita) manage the complex and dangerous relationship between human beings, our environments, and our automobiles.

I’ve written before about how Norwegian roads are among the safest on the planet and about how children in Norway are less likely to die due to traffic than children in virtually any other country on the planet. Today’s article focuses on some factors that tie into why drivers are less likely to be involved in fatal crashes in Norway than in the United States. To put it simply, Norwegian drivers are, on average, safer drivers than Americans. I wanted to find out why, so I learned about the process behind becoming a legal driver on Norwegian roads. The short of it is that by the time a licensed Norwegian driver gets behind the wheel for the first time, s/he has received far better training and is required to behave far more responsibly as a lifelong driver than the equivalent American driver. Let’s look into the how and why together.

1. Norwegian teens don’t drive until they turn 18

To get a category B driver’s license in Norway, which is necessary for driving a car, you need to be at least 18 years old. This is two years longer than in most states in the United States (with the exception of New Jersey, which doesn’t offer an intermediate license until 17, and South Dakota, which allows 14-year-olds to obtain licenses), which gives teenagers two more years to gain crucial cognitive maturity and supervised driving experience.

The provision of additional time for development and practice is particularly key when one notes that, in the United States, 16-19-year-olds have the highest rates of fatal crash involvement per mile for all drivers below the age of 80. Within that subset, 16-17-year-olds have nearly twice the rate of fatal crash involvement per mile as 18-19-year-olds. Norway bypasses the highest risk years by restricting eligibility for driving multi-ton vehicles until drivers are at least 18.

2. Norwegian driver’s education classes are among the most detailed on the planet

Driver’s education in Norway can be divided into three steps: taking the mandatory (and optional) courses, passing the theoretical test, and finally, passing the practical test. The coursework can be divided into four stages: basic traffic knowledge, basic driving skills, road traffic skills, and long-distance training.

In stage 1, you’re required to take courses on first aid and night driving. If you’re under 25, you also need to take a basic traffic course. The basic traffic course is 10 hours long, and the first aid course is 4 hours long and includes training on how to administer basic first aid and effectively convey information to first responders and emergency personnel. You also deal with a simulated crash scene involving crash test dummies. The night driving course is 3 hours long and involves an actual nighttime driving demonstration to illustrate the hazards drivers can encounter during night driving. Before you take any of this, you will typically also take a 45 minute driving assessment so the driving instructor at your driving school can assess your training level and determine whether you’d be likely to pass the practical test with only the mandatory courses or whether you’d also benefit from the optional courses.

In stage 2, you focus on basic driving techniques, including steering, braking, vehicle positioning, and parking. However, you also learn to locate basic parts of the car, including how to open the hood, check and apply wiper fluid, and more. To advance from stage 2 to 3, you need approval from your driving instructor, which comes after a 45-minute driving lesson and a self-assessment you conduct in concert with instructor feedback.

In stage 3, you focus on road traffic, in terms of navigating environments with numerous other vehicles while processing signs and other road information. There are 3 required hours of driving a closed course safety circuit, 3 hours of driving in a 2-lane road, and a 45 minute guidance class again with approval required for advancement. Within stage 3, you also will get slippery road training on the closed circuit. Within this training, you’ll drive on roads coated with oil and water to provide you with exposure to low-traction conditions. Once again, with instructor approval after your 45 minute driving lesson, you’ll be able to advance to stage 4.

In stage 4, you focus on final training before the theoretical and practice tests. There are 13 required hours that are a mixture of driving and theory (class time). No other stages involve class time besides parts of stage 1. The theoretical course presents risky driving situations and means of avoiding or mitigating them. Next comes a 5 hour long-distance driving course, during which you’ll spend up to 5 hours driving under supervision; you also get to practice emergency procedures you’d use if your car malfunctioned. Finally, you have a tour planning course where you need to plan (and then drive) an efficient route to get from point A to B (both selected by the trainer).

The theoretical test is 45 questions long and requires a 85% score (38 questions correct) to pass. If you fail, you need to wait for 2 weeks before you retake it. From then, you have 3 years to pass the practical test. The practical test includes a vehicular safety check, actual driving, and parking after the drive. You learn if you pass at the end of the test. If you fail, you need to wait for 4 weeks before retaking it and take additional courses in between.

In comparison, in the United States, the rules for driver’s licensure vary considerably from state to state due to federalism. However, applicants generally must complete some sort of driver’s training before completing a theoretical and then practical test. The requirements for training may be waived for drivers above a certain age (e.g., 18).

3. It can cost up to $4,000 to obtain a Norwegian driver’s license

In Norway, it’s not unusual to need to spend up to 30,000 NOK (~$4,000 USD) from start to finish in the process of becoming a licensed driver. When you consider the sheer number of mandatory and optional courses you might end up taking on the way to licensure, it’s not surprising. The goal behind the process isn’t simply to extract money from citizens, but to put them through a gauntlet that results in far better competence for beginning drivers there than that in drivers throughout most of the rest of the world.

In comparison, in the United States, it typically doesn’t take more than around $25 to obtain a permit and license, as the US doesn’t consistently require license candidates take professional driving courses, as is the case in Norway and numerous countries around the world. Some states (e.g., Maryland) require a minimal amount of coursework (e.g., 30 hours of class time and 6 hours of driving time), and prices for such courses can reach into the low-to-mid hundreds, which is overpriced for the pittance of hours actually spent driving.

While there is something undeniably democratic about making driver’s licenses essentially free, as they are in most parts of the United States, it does come at a cost, in that it invariably leads to far less trained drivers obtaining their licenses. Of course, each country could fully fund detailed and professional driver’s education (especially countries as rich as the United States and Norway), but it appears far more common to either offer free bare-bones universal training (as is the case in the United States through the public high school system) or expensive private professional training (as is the case in Norway). The Norwegian approach results in far fewer people driving, but it also does result in a significantly safer population behind the wheel, because you can’t just buy your way into a license–you need to do a lot of supervised driving along the way.

4. Every newly licensed driver faces a 2 year probationary period in Norway

It doesn’t matter if you’re 18 or 80; if you’ve passed all the tests, paid all the fees, and become a licensed driver for the first time in Norway, you’re considered to be on probation. It’s called a trial license, and it lasts for 2 years. During this period, it’s literally twice as easy to lose your license as it is when you aren’t in the probationary period.

Norway features a point system, where the accumulation of 8 points in 3 years leads to a temporary revocation of your driving license. Most traffic tickets result in an automatic 2 points. However, if you’re on a trial license, points are doubled. In other words, two traffic tickets in your first two years of driving means a revoked license. The revocation period is typically six months long. However, if it occurs during a trial license, you’ll need to take all of your tests again–both the theoretical (written) tests and the practical (driving) ones. And you don’t get to take them again until after your suspension ends, which means there’s no fast-forwarding the process.

In the US, new and young drivers typically face various forms of probation upon license acquisition, but once again, the details can vary considerably from one state to the next.

Why is the US so much more freewheeling about driving compared to Norway?

The difference in the driving culture between the two countries is likely due to a variety of reasons. However, one of the most pertinent is the US’ much greater identification with the automobile than that present in Norway. This, of course, is largely due to deliberate collusion between the auto industry and the government in the early 20th century, as our highway systems, grid-based cities, and auto-centric living spaces and spacing didn’t arise by accident (or else they would exist in equal degree throughout fellow rich nations, and they most certainly do not). To put it simply, Americans were programmed to view auto travel as the only reasonable means of travel, and our lives were largely spaced in ways that reinforced this line of thought. As a result, it was necessary to make car access as easy as possible for the average person (this also explains credit access in the US, which is far less regulated than its equivalent in fellow rich countries).

How do we change this culture?

We need to drive less, drive more carefully, and advocate for the return of human-centric (and not auto-centric) living spaces. That means lower speeds, fewer cars, more space for people–pedestrians, children, cyclists, the elderly. It means a lot of changes in the long term. It means alternative transportation options–bicycles, buses, trains. And in relation to auto travel, it means following and advocating Vision Zero principles. Every human has the right to live without fear of dying from auto traffic.

If you find the information on car safety, recommended car seats, and car seat reviews on this car seat blog helpful, you can shop through this Amazon link for any purchases, car seat-related or not. Canadians can shop through this link for Canadian purchases.

Driving in Norway Safer than Driving in US (And Reasons Why)

Driving safely...how do we bring that to the US?
Driving safely…how do we bring that to the US?

Recently, I wrote about how Norway, the ice palace that served as the geographic inspiration for Frozen (yes, really), was on the verge of completing their first year since the introduction of the automobile without a single child fatality. That’s right–not a single child under 10 had died a traffic-related death in Norway in 2015 as of early December (3 under 15 would eventually die). This is admirable, and shows just how effective a nationwide effort to practice extended rear-facing can be. It also shows how far we have to go as a nation in the US before we reach the point where virtually no children die due to auto traffic.

That said, I got to wondering: if the roads were that safe for children in Norway, could they also be safer for adults?

The answer is…yes!

It’s safer to be a driver or passenger in Norway than in the US

Per the article in The Local Norway, 113 Norwegians had died on the roadways as of November 2015, making this the safest year so far. In comparison, last year, 147 had died. Let’s use last year’s number and compare it to the 2013 (the most recent available) death toll in the United States: 32,719.

In 2014, there were 5.156 million Norwegians and 147 road deaths. In other words, there were 28.5 road fatalities per million Norwegians, or 2.85 road fatalities per 100,000.

In 2013, there were 316.5 million Americans and 32,719 road deaths in 2013. This figures out to 103.4 road fatalities per million Americans, or 10.34 road fatalities per 100,000.

The ratio of US road deaths to Norwegian road deaths last year, then, was 3.6. In other words, you were almost 4 times more likely to die by auto traffic as an American than a Norwegian.

That’s huge.

To put it another way, if our death rate had been as low as Norway’s, even when scaled up to our much larger population, we would only have lost around 9,092 men, women, and children instead of 32,719. Close to 24,000 lives could have been saved.

Why are Norwegian drivers so much less likely to die than American drivers?

Let’s see what Jan Johansen, the director of Trygg Trafikk (TT), the Norwegian Council for Road Safety, had to say:

“Norwegians have become much better in traffic. People have better attitudes, we have gotten better roads and safer vehicles than we had ten to 15 years ago.”

So drivers in Norway are presumably safer, less aggressive ones. The infrastructure has been improved, in terms of road safety, and the vehicles have been safer.

None of this is magic. We could do all of this here.

How to reduce driver deaths in the US compared to Norway

Regarding the driver component, I’ve written before about how a full 50% of car crash deaths are due to single vehicle crashes–the kind where a driver veers off the road and rolls over or crashes into a tree. Those can be prevented, by far and large, simply by driving at or *below* the speed limit, as well as by driving sober, since both speeding and alcohol are implicated in 1/3rd of vehicular fatalities every single year in the United States.

Of course, additional factors like driving with head lights, driving during the day time, and driving as little as possible also make a significant difference. Norwegians, for example, drive on average 9,300 miles a year, compared to approximately 13,500 miles a year in the US. Since every mile increases your exposure to unsafe drivers, fatigue, poor weather, or other factors beyond your control, no matter how safe of a vehicle you drive or how safe of a driver you are, the less time you spend in a vehicle, the less likely you are to die while driving (or being a passenger).

Regarding infrastructure, simply installing dividers on every road with 40+ mph traffic would go a long way toward reducing highway fatalities, as would installing speed and traffic cameras everywhere. IIf you aren’t speeding, you’re much less likely to crash; it’s that simple. And if there’s separation on high speed roadways, you’re much less likely to kill someone by crossing lanes or be killed by someone else who crossed into your lane. I’ve written about so many lane-crossing fatal collisions in the US that could have been prevented by simple barricades. There is no need for so many of the deaths on our roads.

Regarding vehicle safety, outfitting every vehicle on the road with ESC, side impact airbags, and ensuring they all had good frontal and side scores would do a great deal toward making vehicles safer. However, another crucial step would be to reduce the weight discrepancies on our roads and reduce the overall weights of road vehicles. Small cars are safer for everyone.

There’s no reason for the average driver to have access to a 5,000 pound vehicle (e.g., a large pickup truck) for commuting while other commuters are driving 2,500 pound vehicles (e.g., a subcompact car). In the US, cheap fuel, a lack of taxes based on vehicle weights, mileage, and emissions, and limitless availability of credit results in a vehicular arms race in every city and on every highway throughout the country, where people buy large vehicles because they’re afraid of being left out in the cold with small ones, or simply because they enjoy being able to be in bigger vehicles. It appeals to our lower, primitive brains, but it’s not the direction we need to head in if we’re truly interested in building a safer society.

And no, the solution isn’t to get everyone in 5,000 pound vehicles, because a.) that negates the advantages of heavier vehicles, and b.) that makes life exponentially more difficult (i.e., shorter) for people who will *never* have vehicular protection, such as children, pedestrians, cyclists, and motorcyclists. And no matter what we drive, at some point during the day, every single person in this country who uses a vehicle is a pedestrian, whether through walking or through wheel-chairs. And we all deserve to live without the fear of being run over by giant vehicles.

Does this mean there’s nothing left to be done in Norway for road safety?

However, just because things are much safer in Norway, road-wise, than they are in the US, doesn’t mean Norwegians think things are good enough:

“I would also point out that there is no reason to jump for joy. So far this year, 113 people have been killed. That is 113 too many,” Johansen told Dagbladet.

He’s right; there’s still much more to be done. There’s no reason for any road deaths in any country. But at 113, they’re a lot closer to zero than we are.

If you find my information on best practices in car and car seat safety helpful, you can do your shopping through this Amazon link. Canadians can shop here for Canadian purchases. Have a question or want to discuss best practices? Send me an email at carcrashdetective [at] gmail [dot] com.