
The Toyota Prius is easily the most popular family of hybrids sold around the world, and in the United States in particular. Spurred by the success of the original Prius, Toyota later released the smaller “C” version and the larger “V” variant (although they unfortunately decided to limit the V in the US to a 5-seater instead of giving it the 7-seater option available overseas). At any rate, while all variants of the Prius have found favor with families, the original remains the most popular, followed by the station wagon-styled V, followed by the mini-styled C. One of the most frequently asked questions among Prius owners, especially parents, involves the relative safety of each. They’re all loaded with the latest safety features, but if you’re going to trust your life to a Prius, which is the best to buy?
To answer this question, I turned yet again to the IIHS’ latest batch of driver death rate calculations. I’ve written in the past about how, per IIHS math, the original Prius is just as safe as–or safer than–a variety of much larger cars, pickup trucks, minivans, and SUVs. Today we’ll crunch the numbers again, but this time, comparing each Prius to its platform sibling. Even though the IIHS calculations include lots of error and pay no mind to two of the most important factors in auto safety—how we drive and where we drive–they’re still interesting to review.
This is yet another article in an ongoing series examining the IIHS’ 2017 Status Report (volume 52, number 3); recent crash safety comparisons include Volt, Prius, and Leaf, the Civic and the Accord, the Cruze and Suburban, the Outback, Legacy, and Forester, the Camry and Accord, the CR-V and the Pilot, and the Odyssey and the Sienna. Today we’ll compare the death rate math for each Prius and see if any has a clear safety advantage over the other.
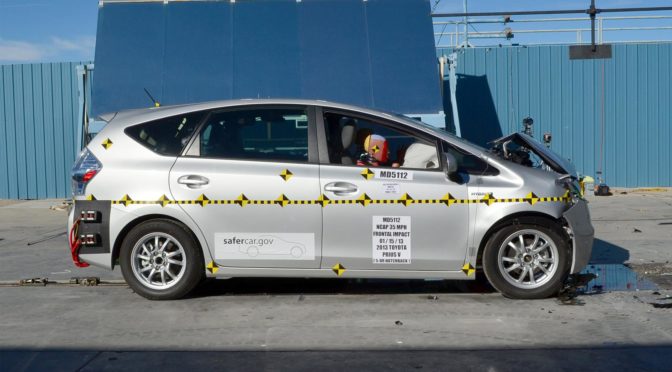
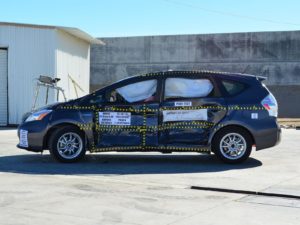
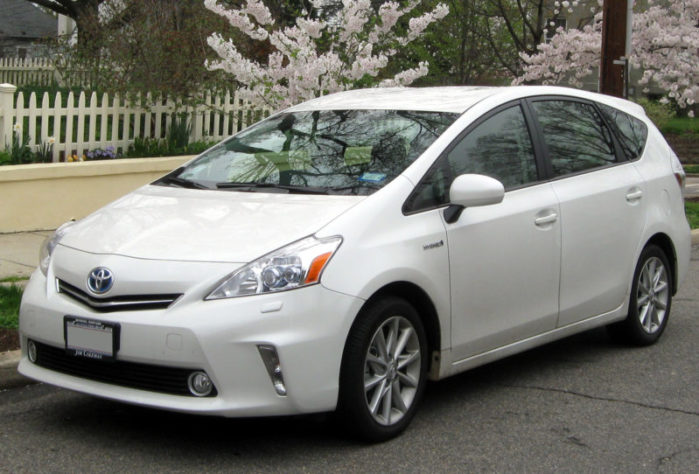
2012-2014 Toyota Prius V (Versatile) – 29 driver deaths (2-56)
 Per the IIHS’ status report, the Prius V had a predicted driver death rate of 29, all from multiple vehicle crashes. The figure is based on an exposure of 245,905 registered vehicle years and a 95% confidence bound of 2-56.
The figure doesn’t mean 29 drivers died behind the wheels of Prius Vs during the surveyed years. Rather, it’s a computation the IIHS came up with after combining NHTSA fatality data for the ’12-’14 Prius V between ’12 and ’15 and IHS data on registered Prius Vs. Running the numbers through statistical programs suggests that, for example, if 1 million drivers drove 1 million of the aforementioned Prius Vs for a year throughout the US, 29 of them would be predicted to die.
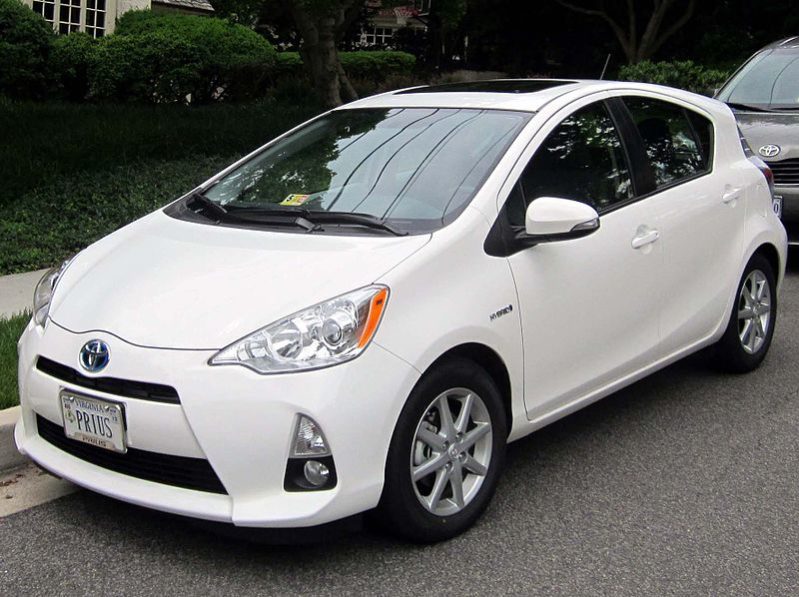
2011-2014 Toyota Prius (Original) – 31 driver deaths (21-42)
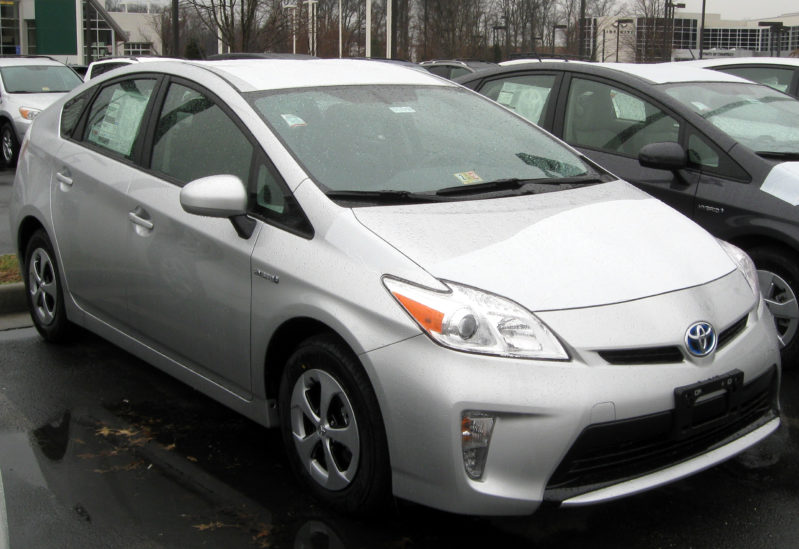 Statistically tied with the Prius V is the original Prius, which clocked in with a driver death rate of 31, with 23 predicted deaths from multiple vehicle collisions and 8 due to single vehicle crashes. The figure was based on an exposure of 1,290,605 registered vehicle years with a 21-42 9% confidence bound. As before, this suggests that, according to the IIHS, if approximately 500,000 million drivers drove the Prius around the US for 2 years, we’d expect 31 of them to die.
As noted in a recent article comparing the driver death rates of the Prius, the Nissan Leaf, and the Chevy Volt, there was no statistical difference between the Prius and two highly cross-shopped hybrid/electrics: the Leaf and the Volt. This is the case here as well; although the Prius had a higher driver death rate than that of the Prius V, statistically, they were the same. We’ll go into why soon below.
2012-2014 Toyota Prius C (City) – 44 driver deaths (18-71)
 Before comparing the three vehicles in depth, let’s review the driver death rate of the smallest Prius, the Prius V. It was estimated to have 44 driver deaths per million registered vehicle years, with 32 predicted multiple car deaths, 12 predicted single car deaths, and 3 of those resulting from rollovers. These figures were based on an exposure of 250,557 registered vehicle years. Once again, the figures suggest, per the IIHS, that if a large population (e.g., 250,000 drivers) drove Prius Cs for an amount of time that equaled 1 million registered vehicle years (in the above example, 4 years), the model predicts 44 would die. However, due to the confidence intervals of 18-71, the C’s safety was statistically indistinguishable from that of the other two Prii. Let’s dive into why.
How can the Prius V, Original, and C be equally safe if they have different driver death rates?
Despite having three different driver death rates, all three vehicles were statistically indistinguishable in driver safety? Why? Because their confidence intervals overlapped.
A 95% confidence bound is a way of estimating where the true driver death rate of a vehicle would span 95% of the time we sampled it by following a population of drivers (e.g., 1 million Prius drivers driving Prii for a year).
Per the IIHS math, that figure would almost always fall between 2 and 56 for the Prius V, between 21 and 42 for the original Prius, and between 18 and 71 for the Prius C. There’s a chance (21-42, or 22, out of 2-71, or 70, or 31%) that all three vehicles shared the same true driver death rate. However, it’s also possible that the lowest true driver death rate belonged to any of the three vehicles; there’s no way to statistically prove which had the lowest. And if this can’t be proven, then practically speaking, each vehicle was just as safe as the other.
Can the same Prius (or other vehicle) really have widely ranging driver death rates?
Yes! A clear example of the effects of confidence intervals on variance in the true driver death rate is visible when comparing the ’11-’14 Prius’ rate of 31 (21-42) here to that in the last driver death rate status report where it had a rate of 16 (5-28) as a ’10-’11 model. While there were slight differences between the Prii involved and perhaps in the statistical models the IIHS used, at least one model year of the Prius overlapped (2011) and, most relevantly, the confidence intervals overlapped (21-28). As a result, despite one driver death rate showing 16 and the other 31, it’s entirely possible (and highly likely) that both model ranges of the Prius were equally safe. Similarly, in the current study, the Prius V’s driver fatality rate at 29 was not statistically different from the original Prius’ rate at 31, which did not statistically vary from the Prius C’s at 44.
Does this mean my loved ones are as safe in the Prius C as they are in the original Prius or Prius V, or vice-versa?
Yes, according to the IIHS’ math. Similarly, since all three vehicles share the same core safety features (i.e., good frontal and side crash scores, side airbags with head protection, and ESC), any passengers in each vehicle would be likely to share the same benefits extended to drivers. If your family has the fortune of traveling in any of these Prii, the safety differences that exist won’t involve the vehicles–which are already very safe–but how and where you drive them.
What can I do to keep my family safe in any Prius, no matter the year or variation?
No matter which Prius you drive, and whether it has the latest safety features or not, the key thing to remember is that the safety of your family does not primarily depend on your vehicle. To keep your loved ones alive, you increase your odds when you choose safe speeds, follow best practices with car seats, and choose safe roads. These are the keys to avoiding and surviving car crashes, no matter what you’re driving.
 If you find my information on best practices in car and car seat safety helpful, you can do your shopping through this Amazon link. Canadians can shop here for Canadian purchases. Have a question or want to discuss best practices? Join us in the forums!