

Whenever the IIHS comes out with its computation of the safest new vehicles on the road by driver death rates, I take a look at the data. While the confidence intervals (margins of error) are huge, trends still tend to pop out, and even though vehicle safety is only one third of a network of motor vehicle best practices (along with individual driver behaviors and road and societal infrastructure), it’s still the segment families are most likely to pay most attention to. Last year I wrote about how the safest small cars are safer than some of the largest SUVs and pickups on the road per driver death rate (DDR) data, and today’s post dives into that train of thought with the most recent DDR data available from the IIHS’ summer 2017 Status Report (volume 52, number 3). Today we’re going to look at three electric and hybrids, the Chevrolet Volt, the Nissan Leaf, and the Toyota Prius.
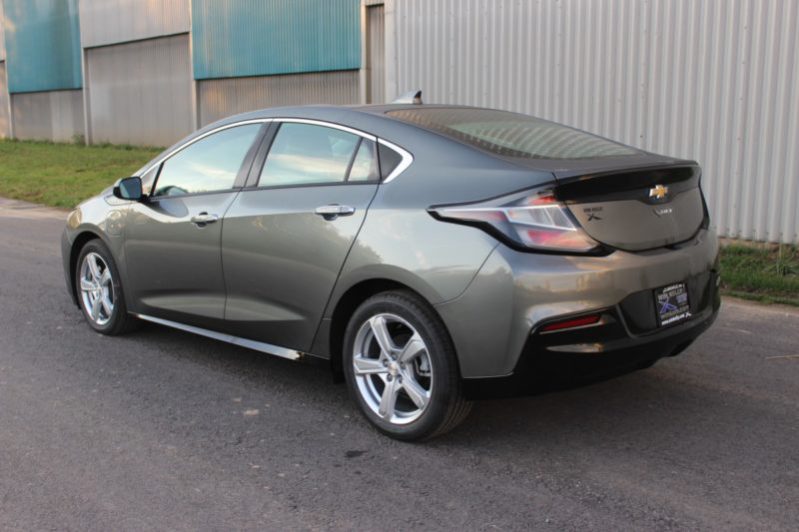
2011-2014 Chevrolet Volt – 7 driver deaths (0-39)
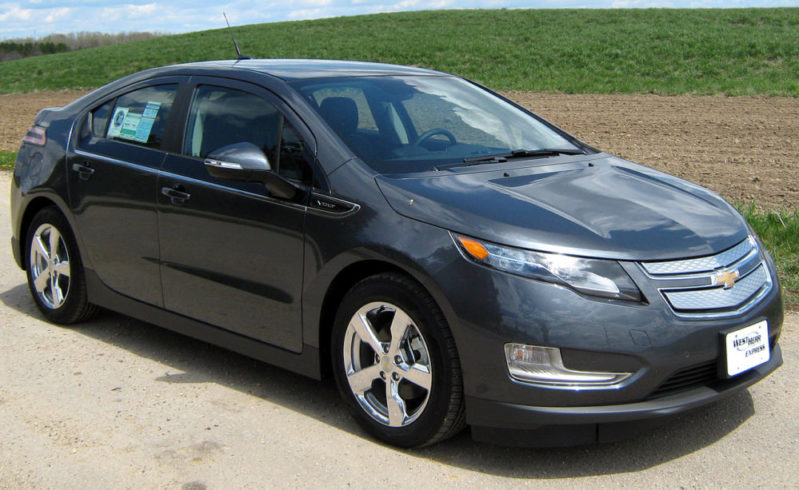 Per the IIHS, the electric / hybrid with the lowest estimated driver death rate during the 2011-2014 model years was the Chevrolet Volt, clocking in at 7 driver deaths over the exposure period. This figure is based on an exposure of 143,042 registered vehicle years, which is IIHS speak for one vehicle registered for one year. To put it plainly, the IIHS is saying that after crunching NHTSA FARS data for vehicle deaths and IHS Automotive data for vehicle registrations, if 1 million individuals drove around in 1 million ’11-’14 Chevy Volts across the country for a year, we would expect only 7 of them to die. This is the best figure ever recorded for a small car in an IIHS driver death rate survey, even besting the 16 achieved by the 2010-2011 Prius in the previous survey. Of the 7 estimated deaths, all occurred due to multiple vehicle collisions (i.e., they all involved another vehicle). There were no single vehicle fatalities in the estimate.
2011-2014 Nissan Leaf – 8 driver deaths (0-44)
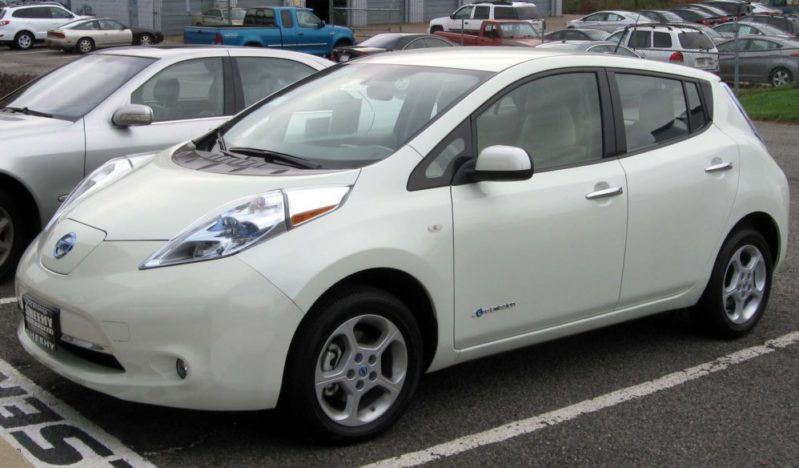 Hot on the trail of the Volt comes the Nissan Leaf, with only 8 estimated deaths during the same exposure period. This figure is based on an exposure of 126,702 registered vehicle years. It’s worthy noting that both the estimated death rate and registered vehicle years of the Leaf are almost identical to those of the Volt, which is why the confidence interval (which is a 95 percent confidence bound) of the Leaf is also almost exactly that of the Volt. Practically speaking, this means both vehicles were exactly the same in terms of the risk of dying in either as a driver during the aforementioned exposure period. Interestingly, while the Volt’s fatalities came exclusively from multiple-vehicle collisions, the Leaf’s were reversed, and came exclusively from single vehicle crashes, which were, more specifically, all from rollovers.
2011-2014 Toyota Prius – 31 driver deaths (21-42)
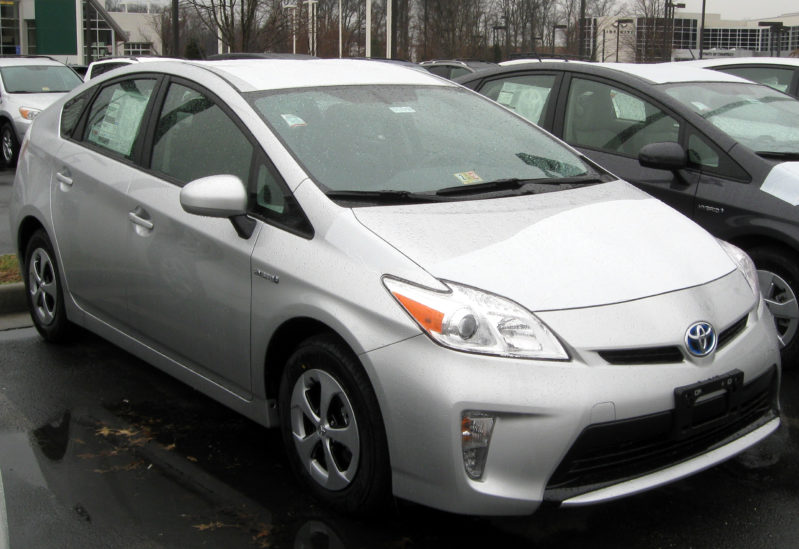 The Prius is the standout among the three vehicles, and not in a good way. With 31 estimated deaths over the same exposure period, it certainly appears to have done more poorly. both relative to the Volt and Leaf and relative to its impressive DDR of 16 during the 2010-2011 model years in the last survey. However, as we’ll discuss below, due to overlapping confidence intervals, there’s no way to say with certainty that it was any less safe than the Volt or Leaf.
The driver death rate figure here is based on an exposure of 1,290,605 registered vehicle years, a figure roughly 10 times as large as that of either the Volt or Leaf. The much larger exposure can be seen as a potential reason for the higher death rate; within the pool of Prius drivers, there would have been much greater odds of careless or unlucky pilots who drove the driver death rate up. An analysis of the crash types leading to the 31 figure shows 23 multiple vehicle crashes and 8 single vehicle crashes, none of which were rollovers.
Does This Mean I Need to Sell My Leaf or Prius for a Volt?
Not at all. It’s important to remember two things: first of all, the confidence intervals in these studies are always quite large, and often encompass most vehicles people reading them are comparing anyway. In this case, the 95% confidence intervals, or 95% probabilities that the true death rate would within the parenthesized bounds when repeatedly sampled, of the Volt (0-39) and Leaf (0-44) overlapped, suggesting, as noted above, that there was no actual difference in likelihood of death as a driver between either vehicle. The only area of no overlap was within 40-44, or 9% of the bound (4/45). As 91% of the bounds overlapped, there’s a 91% chance both vehicles shared the same true driver death rate.
Even the Prius, which had a much higher confidence interval, still overlapped the Volt’s interval by half (e.g., 21-39). The area of no overlap was 0-20 and 40-42, or 24/42, or 57%. This means there was still a 43% chance both vehicles shared the same true driver death rate. So while the Volt and Leaf were both possibly safer to be in than the Prius, we still can’t say that the differences in the numbers weren’t simply due to chance. It’s entirely possible the Prius was the safest of the three; statistically, all three were identical.
Second, the actual odds of dying are quite small; the way the numbers are presented trains our minds to perceive each death rather than the number of individuals who didn’t die. Of course, we do want to value each life, since the ultimate goal of auto travel should be a world where no one loses a life to a motor vehicle (see Vision Zero), but it’s important to keep in mind how good things have already gotten. Flipping the figures makes this more obvious. In the case of the Volt, where there were 7 estimated deaths vs 1 million registered vehicle years, this means the odds of dying in an ’11-’14 Volt were 7/1 million. Or to put it another way, the odds of living when driving an ’11-’14 Volt were 99.9993%.
In the Prius, those odds dropped to a measly 99.9969%.
That looks a lot different than the glaring figure of 31 fatalities, doesn’t it?
What about the Tesla Model S or Model X? Aren’t those safer?
 Yes, no, and maybe. On paper, both the Model S and Model X are safer vehicles than the Volt, Leaf, and Prius (even though neither is perfect; the IIHS noted several flaws in the Model S compared to fellow large cars when they crash tested it). However, the main advantage of both vehicles is that they’re larger, which is only an advantage in head-on collisions against smaller vehicles. Weight isn’t an advantage in side collisions or rollovers. And as noted above, there are plenty of heavy vehicles that are less safe than small cars.
Because not enough Teslas have been sold for the IIHS to factor them into their DDR calculations (they require a minimal exposure of 100,000 registered vehicle years), there simply isn’t a way to know how well the Teslas are doing at keeping their drivers safe besides either a.) tracking individual deaths via news coverage, or b.) crunching the FARS data on your own. Both are options–here, for example, I noted the first Tesla Model S death–but for now, it’s most likely simpler to say that the Teslas are about as safe as the average large non-hybrid car and non-hybrid SUV respectively. On paper, this makes them about as safe as the Volt, which is either pretty darn good, or not that impressive, depending on what you were hoping for.
So What Do I Take Away From All This?
The main thing to take away from this report is that while individual cars are safer than they’ve ever been, it’s still not nearly enough to drive death rates to the ground in the US the way they’ve been dropping like rocks in Europe. We need best practices in road design, because that’s far easier to change than individual driver behaviors, and ultimately far more effective as a result. Cars in Norway, Sweden, or the UK aren’t more sophisticated than those in the US. But they only lose a fraction of their population per capita to auto traffic compared to us because they follow best practices to a much greater degree. The proper speed limits. The proper types of roads. The proper (fewer) miles driven and the transportation alternatives to make this possible. These are the directions that will take us to fewer deaths, if we choose to follow them. We’ll lose a lot more blood for a lot longer if we put our hopes on the vehicular end while waiting for decades for self-driving cars to fully turn over throughout the US driving fleet.
—
If you find the information on car safety, recommended car seats, and car seat reviews on this car seat blog helpful, you can shop through this Amazon link for any purchases, car seat-related or not. Canadians can shop through this link for Canadian purchases.