

The Toyota Sienna and Honda Odyssey are consistently the two most popular minivans in the United States. It’s no surprise why; they’re safer, more reliable, and simply better designed than the competition. Both, interestingly enough, are also manufactured in the United States (in Indiana and Alabama respectively). As a result, it’s no surprise many parents choose them for carting around the family. I’ve compared their safety before, whether in head-to-head comparisons, in side impact safety, or in rollover safety, but I’m always up for writing more articles. Today we’ll compare them via IIHS calculations on driver death rates. Their calculations have loads of error and overlook two of the three top factors in auto safety—how we drive and where we drive–but they’re always interesting to look over. This is yet another article in an ongoing series examining the IIHS’ 2017 Status Report (volume 52, number 3); recent crash safety comparisons include Volt, Prius, and Leaf, the Civic and the Accord, the Cruze and Suburban, the Outback, Legacy, and Forester, the Camry and Accord, and the CR-V and the Pilot. Today we’ll look at the figures behind the safety statistics for two of the most popular family haulers and see if there’s actually a difference between them.
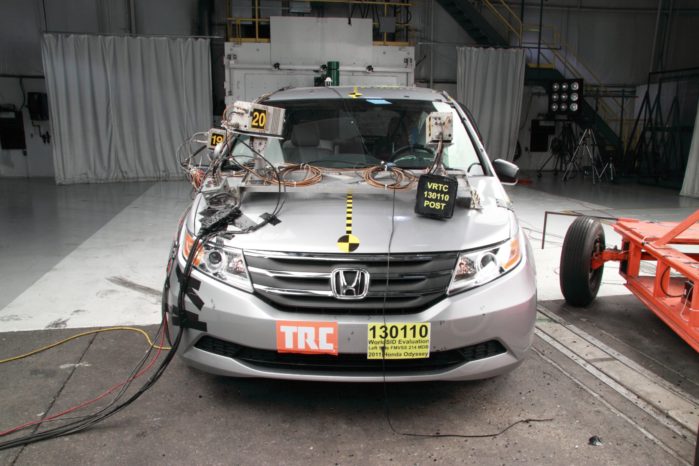
2011-2014 Honda Odyssey – 8 driver deaths (1-15)
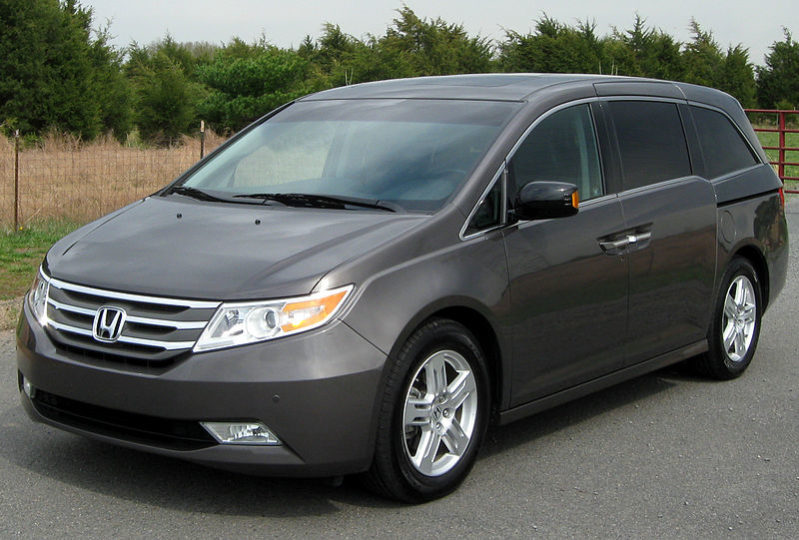 According to the IIHS, the ’11-’14 Honda Odyssey had a driver death rate of 8, with 6 predicted multiple vehicle crash deaths and 2 predicted single vehicle crash deaths both occurring from rollovers. They based their predictions on an exposure of 1,155,445 registered vehicle years with a 95% confidence bound of 1-15.
The stats above don’t mean that there were 8 driver fatalities in the aforementioned model years during the 2012-2015 surveyed years. They mean the IIHS looked at NHTSA fatality statistics for the Odyssey in the aforementioned years and crossed it with IHS data on how many Odysseys were registered in those years. Their number crunching suggests that it, for example, 500,000 drivers drove 500,000 of the aforementioned Odysseys for 2 years throughout the United States, only 8 would be predicted to die. More broadly, if the sets of drivers and vehicles were sampled repeatedly, 95% of the time, the predicted death rate would fall between 1 and 15 (the confidence interval).
2011-2014 Toyota Sienna 2WD – 9 driver deaths (2-16)
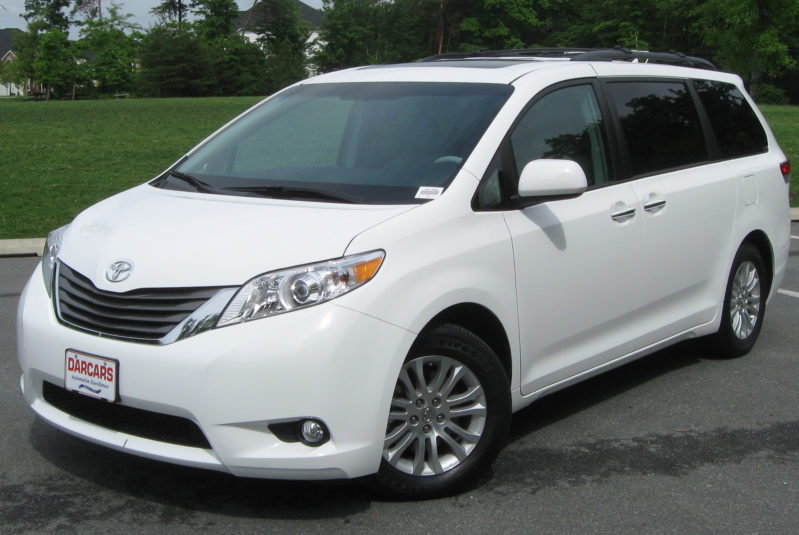 In a statistical tie with the Odyssey, the 2WD ’11-’14 Sienna had a driver death rate of 9, with 6 predicted multiple vehicle fatalities and 3 single vehicle fatalities with 2 of those occurring from rollovers. This exposure was based on a nearly identical 1,175,091 registered vehicle years with a 2-16 95% confidence bound. Again, the general meaning here is that, per the IIHS, if something like 1 million drivers drove 1 million Siennas for a year around the US, we’d expect 9 of them to die.
The 4WD trim had a nearly identical (and again, statistically identical) driver death rate of 10. The confidence bound at 1-37 was significantly larger due to the smaller exposure at 194,536 registered vehicle years (reflective of the fact that only around 11% of total Sienna sales come from the 4WD trim in the US). We can’t state the 2WD trim was safer than the 4WD trim despite the already-tiny difference in driver death rates because both vehicles have overlapping confidence bounds. We’ll dive further into what this means below, but for now, keep in mind that statistically, the 4WD and 2WD Sienna had indistinguishable driver death rates.
How can the Sienna and Odyssey be equally safe if the Odyssey had a (very slightly) lower driver death rate?
The reason the Sienna and Odyssey are equally safe despite the difference in death rates is because both have overlapping confidence bounds. The 95% confidence bounds are a way of expressing where we’d find the true driver death rate 95% of the time we searched for it by sampling drivers of each vehicle (e.g., if we sampled 1 million drivers of Odysseys for a year or 2 million Sienna drivers for 6 months, etc).
According to the IIHS’ math, the Odyssey’s true driver death rate would almost always fall between 1 and 15 while that of the 2WD Sienna would almost always fall between 2 and 16 (1 and 37 for the 4WD). There’s a chance (2-15, or 14, out of 1-16, or 16, or 87%) that the Odyssey and 2WD Sienna shared the same true driver death rate. Even expanding the comparison to all three vehicles, the overlap was 2-15, or 14, out of 1-37, or 37, or 38%, that all three trims of both vehicles shared exactly the same true driver death rate. It’s possible the Odyssey had the lowest true driver death rate. It’s just as possible the Sienna did. There’s no way to know, though, or to statistically prove which vehicle was safer (or safest, if we include the 4WD trim). As a result, all three trims were effectively the same, safety-wise.
Is there a safety difference between the 2WD Sienna and 4WD Sienna?
As noted above, both trims were statistically equal. Although there’s a long-running myth of 4WD being safer than 2WD (which I mention in the CR-V / Pilot comparisons), the statistics don’t show a difference between most vehicles that include both trims when considering actual driving safety as measured by your likelihood of dying while driving. 4WD helps you start when you might get stuck with 2WD (e.g., in heavy snow). It doesn’t increase safety in steering, braking, or stopping. Every four-wheeled vehicle you’ll find on the road has two wheel steering and four wheel braking.
Are my loved ones–my spouse, my children, my family–just as safe in a Sienna as they are in an Odyssey?
Yes, per the IIHS’ calculations. The same essential safety features (i.e., good frontal and side crash scores, side airbags with head protection, and ESC) are present, and these would likely extend the same safety benefits to passengers as they did to drivers. If your family is lucky enough to travel in either vehicle, your primary safety differences won’t involve the vehicles–which are statistically equal in safety–but how and where you drive them.
What is most important for keeping my family safe in a minivan–or a car or SUV?
If you take away one thing from this article, take away the core point that your family’s safety doesn’t primarily depend on the vehicle you’re driving. The most important things you can do to keep your loved ones alive in vehicles are to choose safe speeds, follow best practices with car seats, and choose safe roads. Following these guidelines will up your family’s chances of both avoiding and surviving road trauma more than any benefits you’d get from choosing the “right” vehicle.
 If you find my information on best practices in car and car seat safety helpful, you can do your shopping through this Amazon link. Canadians can shop here for Canadian purchases. Have a question or want to discuss best practices? Join us in the forums!