Tag Archives: autosafety

Side Impact Safety: Volkswagen Atlas Safest SUV of 2018

The 2018 Volkswagen Atlas might be the safest SUV ever made (to date) if you want to survive getting t-boned.

Side impact safety is one of those elements of car safety that you have relatively little control over. Yes, you can avoid roads with the potential for high-speed t-bones, but aside from reducing the number of annual miles you put on your vehicle (the single most effective driving strategy you can master), the design of your vehicle is probably one of the best areas you can invest in for reducing your risk of this kind of crash. So what’s a good vehicle to be in if a side impact is imminent?

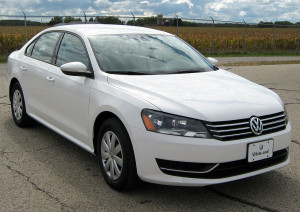
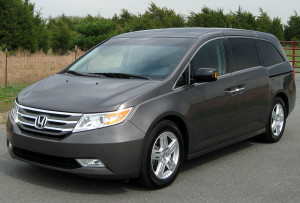
Last month, I wrote about how the 2018 Honda Odyssey had regained the title of the safest minivan to be in when it came to surviving a side impact. I’ve got plenty of articles here on previous rankings for SUVs, minivans, and cars of various sizes. Today we’re going to revisit rankings for 2017-2018 model year SUVs, and as a spoiler, a $30,000 7-seater–the Volkswagen Atlas–is at the top of the heap.

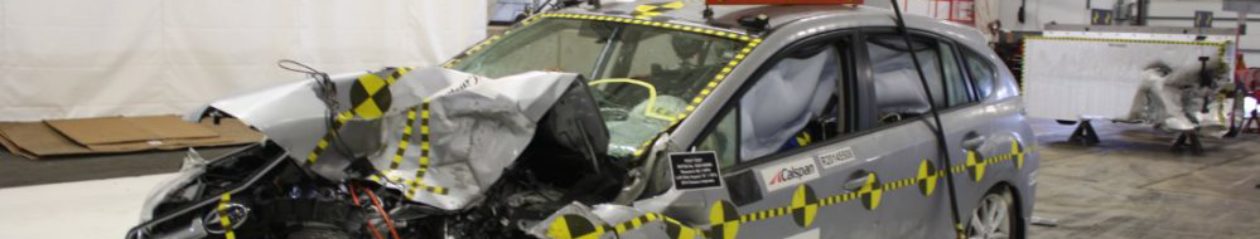
How structural integrity (crush distance) serves as a proxy for side impact resistance

This is the 2018 Atlas after being hit by a deformable barrier in the NHTSA's side impact crash test, but the general principles are the same.
This is the 2018 Atlas after being hit by a deformable barrier in the NHTSA’s side impact crash test, but the general principles are the same.

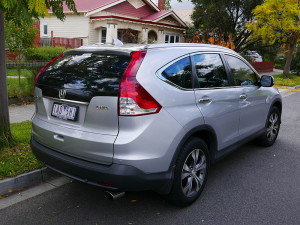
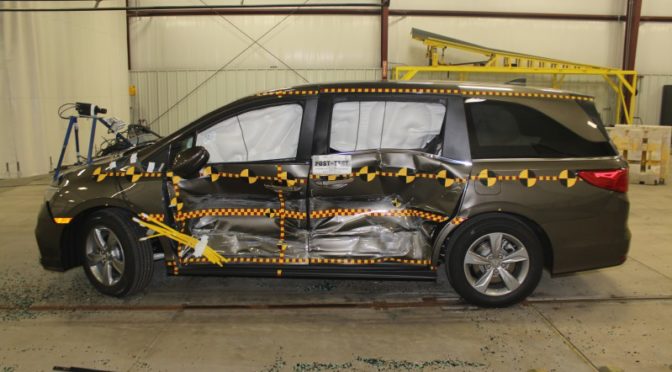
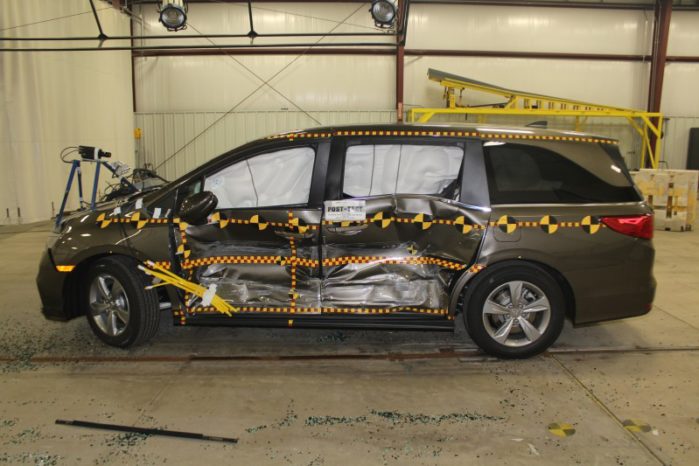
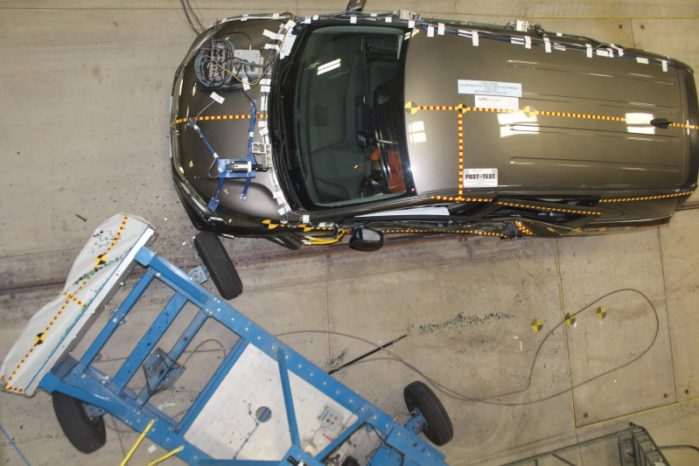
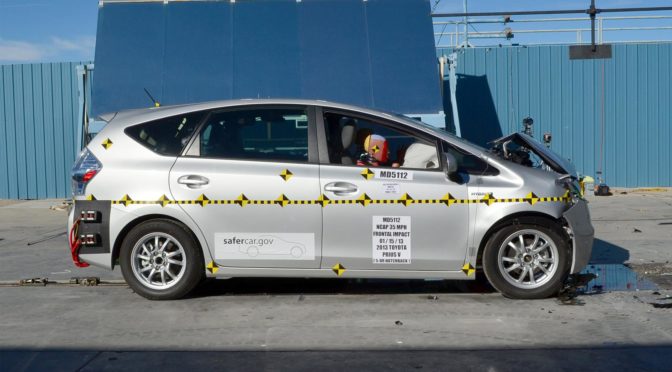
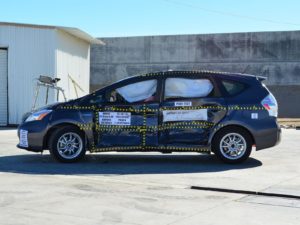
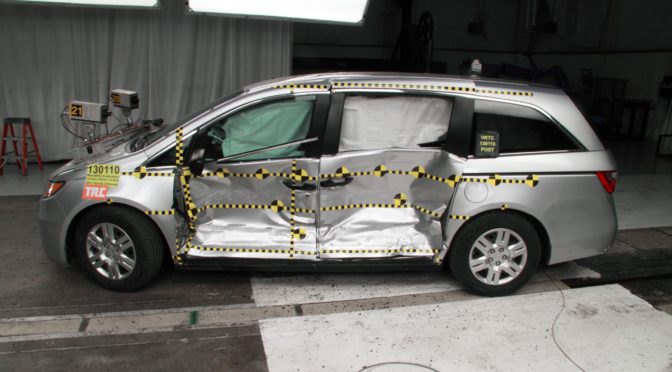
The IIHS’ side impact test resembles the NHTSA’s test, which is based on the NCAP test used around the world. Essentially, the IIHS rams a 3,300 barrier (it represents an SUV of equivalent height, size, and mass, such as a Honda CR-V) into the side of a vehicle at 31 mph, which delivers, per kinetic energy calculators, 143.7 kilojoules of energy. Every vehicle bends somewhat due to such an impact at the B-pillar (the pillar between the front and back doors), and an IIHS sub-score called the “structure and safety cage” tells us how much the B-pillar bent into the center of the driver’s seat at the peak of the collision. The less deformation as measured by increased distance between the driver’s seat center and the B-pillar, the better. It’s kind of like measuring how close you came to being hit in the head by your child swinging a tennis racket, except the racket is a vehicle being driven into your car. We’ll use this metric to rank the top SUVs on the market.

I researched the test scores of every SUV currently available in the US to curate this list, and it’s accurate as of November 2017, with images sourced from the CCD, Wikipedia, or the NHTSA. TheĀ 2017 list of safest SUVs and crossovers for side impact survival is here.

The Six Safest SUVs for Surviving Side Impact Collisions in 2018

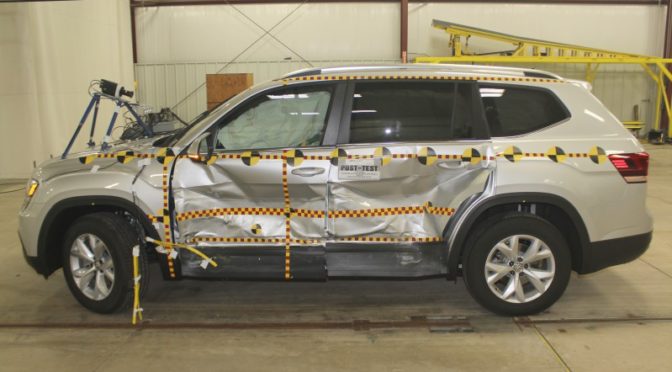
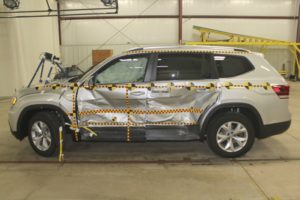
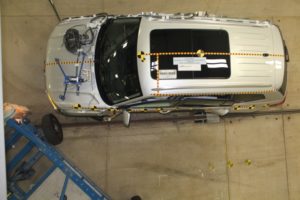
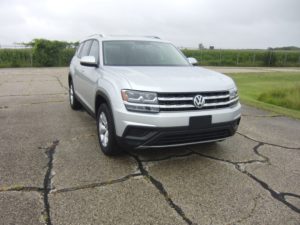
32 cm – 2018 Volkswagen Atlas.

The newly released Volkswagen Atlas is an impressive engineering feat. Designed as a larger, more American-sized version of the Touareg (which has since been discontinued for the US market), the Atlas competes with a range of mid-priced family 3-row SUVs like the Honda Pilot, Toyota Highlander or Sequoia, Chevy Tahoe or Traverse, Ford Explorer, and Dodge Durango, but beats all of them along with a range of luxury 3-row SUVs like the Audi Q7 and Volvo XC90 with a never-before-seen 32 cm of side impact resistance. That’s more thanĀ a full foot of protection relative to the center of the driver’s seat.

Imagine someone driving a Honda CR-V or Ford Escape at you at your driver’s door at 31 mph and having it bounce away from you while leaving a foot of space between it and the center of your seat. That is nothing short of amazing. Volkswagen has done some very naughty things in recent years, but presuming these results are real, they’re setting the standard for everyone else to follow, and the Atlas is a fine mapmaker in that regard. No other car, minivan, SUV, or pickup truck exceeds it (so far).

My list of infant, convertible, and booster seats that will fit 3 across in the Atlas is available here.

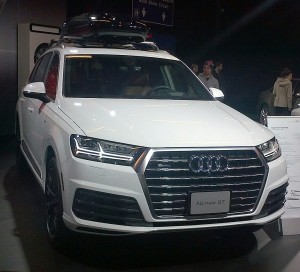
27.5 cm – 2017-2018 Audi Q7.

Almost 6 cm behind the Atlas, but still ahead of every other vehicle beside it, comes a stablemate of the Atlas–the Audi Q7. Given that Audi is a subsidiary of VW the way Lexus belongs to Toyota, it’s a testament again to Volkswagen’s engineering to find both the number one and two spots occupied by their SUVs. The Q7 was the safest SUV for side impacts just one year ago when I last compiled this list. It’s likely going to remain on these lists for at least another decade; very few manufacturers are building cars this strong.

My list of infant, convertible, and booster seats that will fit 3 across in the Q7 is available here.

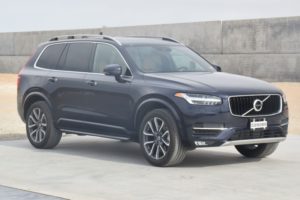
26 cm – 2016-2018 Volvo XC90.

The XC90, which was the leading SUV two short years ago in side impact protection, has fallen to third place, but remains one of the best vehicles to be in during an imminent side impact collision. It’s worth noting that Volvo has yet to address its “acceptable” torso sub-score; that said, the overall strong performance of the XC90 makes up for this shortcoming. The XC90 in its second generation represents a huge step forward from the 9.5 cm of protection offered in the original XC90. That said, it’s important to remember that 9.5 cm was still enough to place the original XC90 and a number of other vehicles mentioned at the end of the article on various IIHS zero driver death rate lists.

My list of infant, convertible, and booster seats that will fit 3 across in the XC90 is available here.

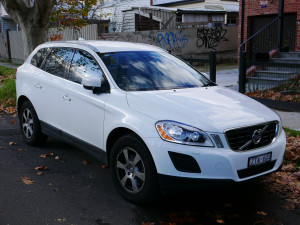
26 cm – 2018 Volvo XC60.

The original XC60 was one of the best SUVs for surviving side impact crashes since its 2010 inception, rounding out the top 6 a full 5 years later in 2015 with its 22 cm of side intrusion protection. Even in 2017, when I last made this list, it rounded up the top 7 SUVs, a full 7 years after its release. That’s good design. The second generation has taken several cm steps forward and is tied for third place with its larger stablemate, the XC90. It is likely to continue to make the top 10 list for another several years into the future.

My list of infant, convertible, and booster seats that will fit 3 across in the XC60 is available here.

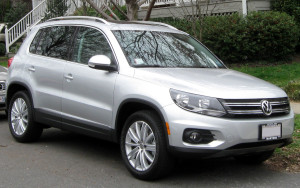
25 cm – 2018 Volkswagen Tiguan.

The second generation TiguanĀ  represents the 3rd and final VW/ Audi superstar on the list. With 25 cm of intrusion protection, it’s another strong showing from the biggest automaker on the planet. It’s worth noting that the Tiguan, having grown significantly in size, is no longer classified by the IIHS as a small SUV, but as a mid-sized SUV.

My list of infant, convertible, and booster seats that will fit 3 across in the Tiguan is available here.

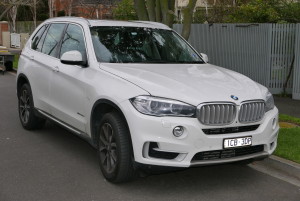
25 cm – 2014-2018 BMW X5.

Rounding up the list and tied with the new Tiguan is the third generation F15 BMW X5. The oldest vehicle on the list, it’s yet another example of the durability of good engineering, at least when it comes to side impact safety. As the X5 is nearing the end of its generation, we’ll have to see if the next gen exceeds it in side impact protection and secures a higher position on next year’s list.

My list of infant, convertible, and booster seats that will fit 3 across in the X5 is available here.

What if I can’t afford (or don’t want to buy) any of these SUVs?

If all of these SUVs are either out of budget or not your cup of tea, never fear. There are a great many others that offered excellent performance but fell just behind the cutoff level I established at 25 cm. For example, the 2016-2018 Mercedes-Benz GLC and the 2011-2015 Mercedes-Benz GLK (which MB would rename a year later as the GLC) are both right on the heels of the X5 and Tiguan at 24 cm. The 2016-2018 Lexus RX is right there with them at 24 cm. Just behind them we find the 2009-2017 Audi Q5, which had 23 cm of protection in an era when most vehicles didn’t offer more than 12 cm.

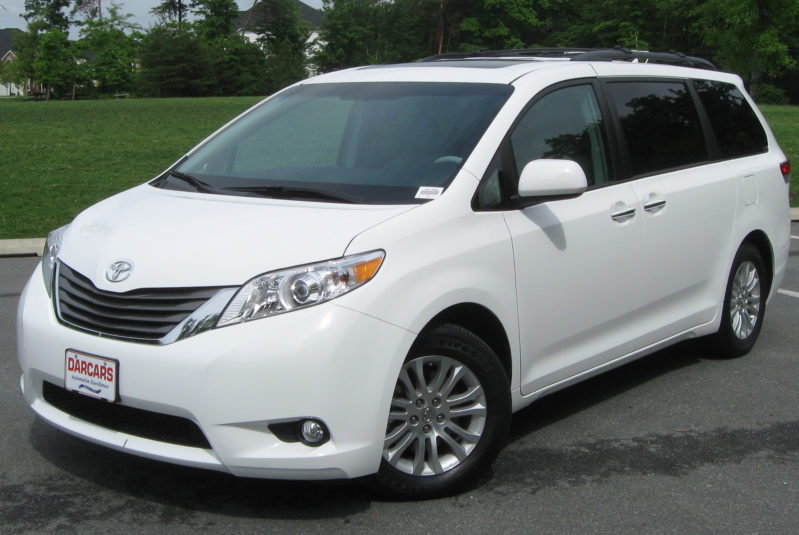
More broadly, remember that what you’re driving isn’t what primarily determines your family’s safety–not even in side impact collisions. What primarily impacts your safety and that of your loved ones is the degree to which you remember to choose safe speeds, follow best practices with car seats,Ā  and choose safe roads. If you do so, you’ll have much better odds of avoiding and surviving side, frontal, or rear crashes than anyone driving any of the vehicles above, even if you’re in something with only a few cm of side impact protection. Remember that the 2008 Toyota Sienna, the first minivan to appear on an IIHS zero death list 10 model years ago (Status Report Vol. 46, No. 5), had a whopping 8.5-9.5 cm of side intrusion protection. The 2007 Ford Edge, the first family mid-sized SUV to make the zero list, had 9 cm of side impact protection. And the aforementioned original XC90 also came in at 9.5 cm of side impact protection, which, as noted earlier, also landed it on a zero list (Status Report Vol. 50, No. 1).

It’s not the vehicle that makes the difference; it’s how and where you drive it.

If you find my information on best practices in car and car seat safety helpful, you can buy my books here or do your shopping through this Amazon link. Canadians can shop here for Canadian purchases. Have a question or want to discuss best practices? Send me an email at carcrashdetective [at] gmail [dot] com.

IIHS and NHTSA Comparison, Flaws, and the Passenger Small Overlap Crash Test

Both the IIHS and NHTSA leave elements on the table when it comes to overall auto safety.

The IIHS is always looking for ways to make cars safer for insurance companies. This has good and bad ramifications for us; on one hand, because their standards are almost always more rigorous than those of the NHTSA (which should not be the case, given that the IIHS is privately funded while the NHTSA is a governmental organization), we end up with cars that pass more stringent crash tests and receive safer technologies sooner than we otherwise would have. A strong example of this is side airbag market penetration; virtually every new vehicle sold today in the United States for passenger use features side airbags with head and torso protection in the front row and head protection in rear rows.

The NHTSA has repeatedly left a number of regulatory changes to the “market”, and little has been done in those areas as a result

This technology–side airbags with head and torso coverage–is incredibly important and saves lives every day; I recommend it along with ESC as the baseline requirements for a safe vehicle for families, teenagers, or single individuals. Yet side airbagsĀ still are not required in vehicles by the NHTSA. If not for the IIHS, most vehicles probably still wouldn’t have them. But this is only one of many oversights by the NHTSA (e.g., their lack of standards regarding seat collapse, their general lack of efforts to promote extended rear-facing, their lack of meaningful advocacy for lower BAC levels, theirĀ tacit acceptance of high speed limits as an American tradition…). And that’s not today’s topic. As I was saying, the IIHS does lots of good things. But they also have their own errors and blind spots, and some of them are huge.

The IIHS encourages a number of bad policies in auto manufacturing and ignores a large swath of overall auto safety

The IIHS encourages larger, heavier vehicles, losing sight of the big picture that such vehicles make the roads less safe for everyone in the end.

They encourage a perpetual arms race toward ever-larger vehicles, consistently ignoring the fact that placing teenagers behind the wheel of heavy vehicles makes the roads more dangerous for everyone beside such teenagers. They also deliberately ignore the greater crime of encouraging heavy vehicles in a world filled with children, pedestrians, and motorcyclists, all of whom have no defenses whatsoever against ever-larger vehicles and are more likely to be killed by them. They also pay virtually no attention to safety developments overseas, particularly Vision Zero and Safe System research and practice, which have led to dramatic decreases in car-related deaths throughout Europe while the US’ numbers stagnate and periodically rise and fall with the economy. They focus nearly exclusively on one third of the auto safety triangle–what we drive, but notĀ how we drive orĀ where we drive; two factors that make far more of a difference than the vehicles themselves.

What’s the newest IIHS small overlap crash test about?

As a result,Ā  while I generally support the IIHS’ efforts, I do so cautiously. They’ve recently come out with another crash test. It’s the passenger-side version of their small overlap test. The reasoning behind it came from a spot check they did some years back that I wrote about here where they found most manufacturers were only reinforcing the driver side of their vehicles for the small overlap test–teaching to the test, as it were–and neglecting the passenger side. Was this actually translating into fatalities? Probably. The IIHS hinted they’d start testing this in the future, and a few years later, they’ve rolled out the test. Is it a good thing?

I think so. While the number of lives saved by a fleet full of vehicles with good passenger-side small overlap crash scores vs poor ones might pale as a proportion of the 35,000 people we lose annually on our bloodbath highways, every life is valuable, and if it costs manufacturers a minor amount of money to design symmetrically safe vehicles, it’s worth doing. So now that they’ve rolled out the new test, are there any vehicles who did particularly well or particularly poorly on it?

Yes!

Which cars, SUVs, and minivans are doing well and poorly on the new passenger-side IIHS small overlap crash test?

The Camry is one of the safest family cars you can buy today--it has good scores in every single area tested by the IIHS.
The Camry is one of the safest family cars you can buy today–it has good scores in every single area tested by the IIHS.

The Good: So far, a range of 2017 and 2018 mid-sized sedans have received good ratings in the passenger small overlap crash test, including the Ford Fusion, Honda Accord, Subaru Legacy, Subaru Outback, Hyundai Sonata, Mazda 6, Nissan Altima, Nissan Maxima, and Toyota Camry.

Among SUVs, the 2016-2017 Hyundai Tucscon received a good rating; it’s the only tested SUV to have received such a score so far.

The CR-V is by far the most popular small SUV in the United States. It does well or acceptably in all tests, including the passenger small overlap.

The Acceptable: The 2017 Volkswagen Jetta received an overall acceptable score due to an acceptable structural sub-score and a marginal sub-score for passenger restraints and kinematics. To put it plainly, the car’s frame bent a bit more than the IIHS would have liked and the passenger dummy moved far more than they’d have liked to have seen.

Among SUVs, the 2015-2017 Buick Encore, Honda CR-V, and Mazda CX-5 received acceptable scores.

While the Passat is still one of the safest cars around, it only received a marginal score in the passenger small overlap test.

The Marginal: The 2017 Volkswagen Passat received an overall marginal score due to only acceptable sub-scores in both structure and passenger head and neck areas and a marginal passenger restraints and kinematics score. The acceptable head and neck score suggests injuries would have been possible to the head and neck (i.e., the most important parts of the body) of a passenger in a 40 mph small overlap crash with a Passat-sized vehicle or fixed barrier (e.g., a wall). The reason the score wasn’t simply acceptable like that of the Jetta was because there were multiple acceptable sub-scores instead of just one paired with the marginal sub-score.

The 2018 Chevrolet Malibu also received a marginal score overall due to the same flaws as the Passat as well as an acceptable sub-score for passenger injury in the lower leg and foot areas.

The 2014-2018 Subaru Forester also received a marginal overall score due to a poor structure and safety cage sub-score and an acceptable sub-score for passenger injury in the lower leg and foot. While every other sub-score was good, the presence of a poor score meant the overall score could not be any higher than marginal.

Toyota dropped the ball with the RAV4. It's still a safe vehicle overall, but it scored poorly in the passenger small overlap test.
Toyota dropped the ball with the RAV4. It’s still a safe vehicle overall, but it scored poorly in the passenger small overlap test.

The Poor: The 2015-2018 Toyota RAV4 earned the dubious distinction of being the only vehicle so far to have received a poor overall rating. It’s particularly bad since the IIHS originally tested the RAV4 back in 2016 and foreshadowed making the test an official part of their regimen, and Toyota chose not to modify the RAV4. This has happened before, such as with the original small overlap test; when the Camry received a poor score, Toyota was forced to modify it within the model year after Consumer Reports pulled its recommendation of the vehicle. Toyota needs to stop getting caught flat-footed in this area; they have the budget to make safe cars, and do so year after year with a range of models. Today the Camry is one of the best-scoring vehicles tested by the IIHS, including in both halves of the small overlap test.

If you find my information on best practices in car and car seat safety helpful, you can buy my books here or do your shopping through this Amazon link. Canadians can shop here for Canadian purchases. Have a question or want to discuss best practices? Send me an email at carcrashdetective [at] gmail [dot] com.

Side Impact Safety: Honda Odyssey Safest Minivan Again in 2018

The 2018 Odyssey is the safest minivan ever made (so far) when it comes to side impact crash resistance.

I’ve written endlessly about side impact collisions and how dangerous they can be for all of us who travel in passenger-sized vehicles. They are overrepresented in fatal crash scenarios, and have been so for years in every country with modern infrastructure. As illustrated in an earlier post on fatality rates in side impact collisions, even though only 21% of all collisions feature side impacts, 34% of fatal multiple-vehicle collisions involve side impacts, compared to frontal impacts, which make up 52% of all collisions and 56% of fatal multi-vehicle collisions, and rear impacts, which make up 28% of all collisions and only 8% of fatal multiple-vehicle crashes. To put it simply, despite side impacts being the least common type of crash, they’re proportionally the most likely to be deadly. So what can we do about them?

Which factors affect your odds of dying in a side impact collision?

No matter where you live, there are three primary factors in auto safety: how you drive, what you drive, and where you drive. You can reduce your odds of dying in a side impact collision by increasing your driving safety–e.g., avoiding driving entirely, limiting annual miles driven, following the speed limit, and so on. You can also improve your odds of survival by monitoring where you drive–e.g., on divided vs. undivided roads, or in areas with lower speed limits, speed and traffic cameras, and forgiving roads. However, today we’ll look at how to increase your odds of avoiding and surviving side impact crashes by changing what you drive–specifically by choosing the minivans with the greatest levels of side impact resistance available in 2018.

Structural integrity (crush distance) as a metric for side impact resistance

This is the 2018 Odyssey after an NHTSA crash test, but the principles behind the test are similar to that of the IIHS.

I’ve written about the IIHS’ side impact test in detail in previous posts on surviving side impact crashes in cars, minivans, and SUVs, but here’s the short version: the IIHS has a side impact test that involves ramming a 3,300 lb barrier (with the same height and size profile of an equivalent-weight SUV) into a vehicle’s side at 31 mph, delivering 143.7KJ of kinetic energy. This deforms every vehicle to some degree at the B-pillar, and the IIHS’ subscore called the “structure and safety cage” measures how deeply the B-pillar intrudes into the center of the driver’s seat during the collision. The less it does, as reflected by increased distance between the B-pillar and the center of the driver’s seat, the better. We’ll use this metric to rank the minivans on the market.

I combed through test scores of every minivan currently sold in the US to make this list, and it’s accurate as of mid October 2017, with images sourced from yours truly, Wikipedia, or the NHTSA. The 2016 minivan side impact review is here.

The 5 safest minivans for surviving side impact collisions in 2018

21.5 cm – 2018 Honda Odyssey.

The newest version of the Honda Odyssey looks, feels, and drives very similarly to the prior generation; it speaks to the strong foundation established in the model that preceded it. The most significant change in side impact protection is a slight increase in door and frame strength leading to a B-pillar distance of 21.5 cm from the center of the driver’s seat.

19.5 cm – 2017 Chrysler Pacifica.

2017-pacifica-selfThe last time I wrote a side impact comparison of minivans available in the US and Canadian market, the Chrysler Pacifica had just come onto the scene and pushed the Odyssey out of first place for the first time since 2010, when the Sienna led with 8.5 cm. Chrysler brought their A-game to the Pacifica, and I was happy to see a significant challenger to the Odyssey’s 6-year reign from 2011-2016. However, with the new Odyssey, the Pacifica has slipped into second place, which is still very respectable. The difference between it and the first place ’18 Odyssey is a scant 2 cm.

18.5 cm – 2011-2017 Honda Odyssey.

odyssey-2011-publicdomainIf the Pacifica receives credit for coming in only 2 cm behind the current Odyssey, the previous Odyssey deserves heaps of credit for having a 6-year old design (dating back to 2011) that falls only 1 cm short of a minivan more than half a decade newer (the current Pacifica) and 3 cm short of the current leader, which is the current Odyssey. The 2011+ Odyssey currently represents the sweet spot for side impact safety among used minivans, and its value is hard to beat. This van also had a driver death rate of 8 for the ’11-’14 model years per the most recent IIHS survey.

14.5 cm – 2015-2017 Kia Sedona.

sedona - 2015 - publicdomainThe Sedona is several cm behind the previous gen Odyssey and even farther behind the current Odyssey, but it still provides a solid 14.5 cm of side impact resistance at the B-pillar. Not enough have been sold to show up in any IIHS driver death rate surveys, but the previous generation Sedona was one of the best performing minivans of its generation, and it’s likely that the current generation Sedona will rank as well as the perennial chart-toppers, the Sienna and the Odyssey, once it sells enough models in the current generation.

14-15.5 cm – 2011-2017 Toyota Sienna.

sienna--publicdomainFinally, the Sienna rounds up the list of recent-model year minivans worth purchasing for side impact safety. At 14 cm of side impact resistance, it slots right behind the Sedona. A different test by Toyota gave it 15.5 cm, but I always rank via the lower score, as it’s the more conservative value. It’s worth keeping in mind that although the Sienna has less side impact resistance on paper than the equivalent 2011-2017 Odyssey, both vehicles have statistically identical driver death rates per the most recent IIHS driver death rate, showing again that how and where vehicles are driven has far more of an effect on driver safety than what vehicles are driven, even though both vehicles are nearly identical in on-paper safety to begin with.

What about the Quest, Town & Country, and Grand Caravan?

There are several minivans that didn’t make the list because they’re so far behind the aforementioned minivans that I wouldn’t consider them if I had the choice. The Quest, Town & Country, and Grand Caravan continue to come in last position, just as they did when I last wrote this article. The Pacifica clearly showsĀ  Fiat Chrysler America can make a class-leading minivan when they decide to; they have not yet decided to with either the T&C or with the GC, both of which don’t score any better in side impact resistance in 2017 than the 2006 Toyota Sienna made *11*Ā  years earlier.

What if I can’t afford any of these vans?

Remember that no matter what you’re driving, and whether your van appears on this list or not, the majority of your family’s safety won’t depend in majority on your minivan (or SUV, or car, or pickup truck). It will depend on the degree to which you consistently choose safe speeds, follow best practices with car seats,Ā  and choose safe roads. These are the factors that have the greatest impact on whether you can avoid and survive car crashes, no matter whether you’re in a 2018 Odyssey, a 2006 Sienna, or anything in between.

ā€”

If you find the information on car safety, recommended car seats, and car seat reviews on this car seat blog helpful, you can shop through this Amazon link for any purchases, car seat-related or not. Canadians can shop through this link for Canadian purchases.

Which Prius is Safest for Families? Original, “C”, or “V”? Per IIHS Driver Death Rates

According to the IIHS' 2017 driver death rate calculations, a Toyota Prius V, C, and Original are equally safe vehicles to drive.
According to the IIHS’ 2017 driver death rate calculations, a Toyota Prius V, C, and Original are equally safe vehicles to drive.

The Toyota Prius is easily the most popular family of hybrids sold around the world, and in the United States in particular. Spurred by the success of the original Prius, Toyota later released the smaller “C” version and the larger “V” variant (although they unfortunately decided to limit the V in the US to a 5-seater instead of giving it the 7-seater option available overseas). At any rate, while all variants of the Prius have found favor with families, the original remains the most popular, followed by the station wagon-styled V, followed by the mini-styled C. One of the most frequently asked questions among Prius owners, especially parents, involves the relative safety of each. They’re all loaded with the latest safety features, but if you’re going to trust your life to a Prius, which is the best to buy?

To answer this question, I turned yet again to the IIHS’ latest batch of driver death rate calculations. I’ve written in the past about how, per IIHS math, the original Prius is just as safe as–or safer than–a variety of much larger cars, pickup trucks, minivans, and SUVs. Today we’ll crunch the numbers again, but this time, comparing each Prius to its platform sibling. Even though the IIHS calculations include lots of error and pay no mind to two of the most important factors in auto safetyhow we drive and where we drive–they’re still interesting to review.

This is yet another article in an ongoing series examining the IIHS’ 2017 Status Report (volume 52, number 3); recent crash safety comparisons include Volt, Prius, and Leaf, the Civic and the Accord, the Cruze and Suburban, the Outback, Legacy, and Forester, the Camry and Accord, the CR-V and the Pilot, and the Odyssey and the Sienna. Today we’ll compare the death rate math for each Prius and see if any has a clear safety advantage over the other.

2012-2014 Toyota Prius VĀ  (Versatile) – 29 driver deaths (2-56)

Per the IIHS’ status report, the Prius V had a predicted driver death rate of 29, all from multiple vehicle crashes. The figure is based on an exposure of 245,905 registered vehicle years and a 95% confidence bound of 2-56.

The figure doesn’t mean 29 drivers died behind the wheels of Prius Vs during the surveyed years. Rather, it’s a computation the IIHS came up with after combining NHTSA fatality data for the ’12-’14 Prius V between ’12 and ’15 and IHS data on registered Prius Vs. Running the numbers through statistical programs suggests that, for example, if 1 million drivers drove 1 million of the aforementioned Prius Vs for a year throughout the US, 29 of them would be predicted to die.

2011-2014 Toyota Prius (Original) – 31Ā driver deaths (21-42)

Statistically tied with the Prius V is the original Prius, which clocked in with a driver death rate of 31, with 23 predicted deaths from multiple vehicle collisions and 8 due to single vehicle crashes. The figure was based on an exposure of 1,290,605 registered vehicle years with a 21-42 9% confidence bound. As before, this suggests that, according to the IIHS, if approximately 500,000 million drivers drove the Prius around the US for 2 years, we’d expect 31 of them to die.

As noted in a recent article comparing the driver death rates of the Prius, the Nissan Leaf, and the Chevy Volt, there was no statistical difference between the Prius and two highly cross-shopped hybrid/electrics: the Leaf and the Volt. This is the case here as well; although the Prius had a higher driver death rate than that of the Prius V, statistically, they were the same. We’ll go into why soon below.

2012-2014 Toyota Prius C (City) – 44Ā driver deaths (18-71)

Before comparing the three vehicles in depth, let’s review the driver death rate of the smallest Prius, the Prius V. It was estimated to have 44 driver deaths per million registered vehicle years, with 32 predicted multiple car deaths, 12 predicted single car deaths, and 3 of those resulting from rollovers. These figures were based on an exposure of 250,557 registered vehicle years. Once again, the figures suggest, per the IIHS, that if a large population (e.g., 250,000 drivers) drove Prius Cs for an amount of time that equaled 1 million registered vehicle years (in the above example, 4 years), the model predicts 44 would die. However, due to the confidence intervals of 18-71, the C’s safety was statistically indistinguishable from that of the other two Prii. Let’s dive into why.

How can the Prius V, Original, and C be equally safe if they have different driver death rates?

Despite having three different driver death rates, all three vehicles were statistically indistinguishable in driver safety? Why? Because their confidence intervals overlapped.

A 95% confidence bound is a way of estimating where the true driver death rate of a vehicle would span 95% of the time we sampled it by following a population of drivers (e.g., 1 million Prius drivers driving Prii for a year).

Per the IIHS math, that figure would almost always fall between 2 and 56 for the Prius V, between 21 and 42 for the original Prius, and between 18 and 71 for the Prius C. There’s a chance (21-42, or 22, out of 2-71, or 70, or 31%) that all three vehicles shared the same true driver death rate. However, it’s also possible that the lowest true driver death rate belonged to any of the three vehicles; there’s no way to statistically prove which had the lowest. And if this can’t be proven, then practically speaking, each vehicle was just as safe as the other.

Can the same Prius (or other vehicle) really have widely ranging driver death rates?

Yes! A clear example of the effects of confidence intervals on variance in the true driver death rate is visible when comparing the ’11-’14 Prius’ rate of 31 (21-42) here to that in the last driver death rate status report where it had a rate of 16 (5-28) as a ’10-’11 model. While there were slight differences between the Prii involved and perhaps in the statistical models the IIHS used, at least one model year of the Prius overlapped (2011) and, most relevantly, the confidence intervals overlapped (21-28). As a result, despite one driver death rate showing 16 and the other 31, it’s entirely possible (and highly likely) that both model ranges of the Prius were equally safe. Similarly, in the current study, the Prius V’s driver fatality rate at 29 was not statistically different from the original Prius’ rate at 31, which did not statistically vary from the Prius C’s at 44.

Does this mean my loved ones are as safe in the Prius C as they are in the original Prius or Prius V, or vice-versa?

Yes, according to the IIHS’ math. Similarly, since all three vehicles share the same core safety features (i.e., good frontal and side crash scores, side airbags with head protection, and ESC), any passengers in each vehicle would be likely to share the same benefits extended to drivers. If your family has the fortune of traveling in any of these Prii, the safety differences that exist won’t involve the vehicles–which are already very safe–but how and where you drive them.

What can I do to keep my family safe in any Prius, no matter the year or variation?

No matter which Prius you drive, and whether it has the latest safety features or not, the key thing to remember is that the safety of your family does not primarily depend on your vehicle. To keep your loved ones alive, you increase your odds when you choose safe speeds, follow best practices with car seats,Ā  and choose safe roads. These are the keys to avoiding and surviving car crashes, no matter what you’re driving.

If you find my information on best practices in car and car seat safety helpful, you can do your shopping through this Amazon link. Canadians can shop here for Canadian purchases. Have a question or want to discuss best practices? Join us in the forums!

Minivan Safety: Which is safer, a Toyota Sienna or Honda Odyssey? Neither, Per IIHS Driver Death Rates

According to the IIHS' 2017 driver death rate calculations, a Honda Odyssey is no safer (or more dangerous) than a Toyota Sienna.
According to the IIHS’ 2017 driver death rate calculations, a Honda Odyssey is no safer (or more dangerous) than a Toyota Sienna.

The Toyota Sienna and Honda Odyssey are consistently the two most popular minivans in the United States. It’s no surprise why; they’re safer, more reliable, and simply better designed than the competition. Both, interestingly enough, are also manufactured in the United States (in Indiana and Alabama respectively). As a result, it’s no surprise many parents choose them for carting around the family. I’ve compared their safety before, whether in head-to-head comparisons, in side impact safety, or in rollover safety, but I’m always up for writing more articles. Today we’ll compare them via IIHS calculations on driver death rates. Their calculations have loads of error and overlook two of the threeĀ top factors in auto safetyhow we drive and where we drive–but they’re always interesting to look over. This is yet another article in an ongoing series examining the IIHS’ 2017 Status Report (volume 52, number 3); recent crash safety comparisons include Volt, Prius, and Leaf, the Civic and the Accord, the Cruze and Suburban, the Outback, Legacy, and Forester, the Camry and Accord, and the CR-V and the Pilot. Today we’ll look at the figures behind the safety statistics for two of the most popular family haulers and see if there’s actually a difference between them.

2011-2014 Honda Odyssey – 8 driver deaths (1-15)

According to the IIHS, the ’11-’14 Honda Odyssey had a driver death rate of 8, with 6 predicted multiple vehicle crash deaths and 2 predicted single vehicle crash deaths both occurring from rollovers. They based their predictions on an exposure of 1,155,445 registered vehicle years with a 95% confidence bound of 1-15.

The stats above don’t mean that there were 8 driver fatalities in the aforementioned model years during the 2012-2015 surveyed years. They mean the IIHS looked at NHTSA fatality statistics for the Odyssey in the aforementioned years and crossed it with IHS data on how many Odysseys were registered in those years. Their number crunching suggests that it, for example, 500,000 drivers drove 500,000 of the aforementioned Odysseys for 2 years throughout the United States, only 8 would be predicted to die. More broadly, if the sets of drivers and vehicles were sampled repeatedly, 95% of the time, the predicted death rate would fall between 1 and 15 (the confidence interval).

2011-2014 Toyota Sienna 2WD – 9 driver deaths (2-16)

In a statistical tie with the Odyssey, the 2WD ’11-’14 Sienna had a driver death rate of 9, with 6 predicted multiple vehicle fatalities and 3 single vehicle fatalities with 2 of those occurring from rollovers. This exposure was based on a nearly identical 1,175,091 registered vehicle years with a 2-16 95% confidence bound. Again, the general meaning here is that, per the IIHS, if something like 1 million drivers drove 1 million Siennas for a year around the US, we’d expect 9 of them to die.

The 4WD trim had a nearly identical (and again, statistically identical) driver death rate of 10. The confidence bound at 1-37 was significantly larger due to the smaller exposure at 194,536 registered vehicle years (reflective of the fact that only around 11% of total Sienna sales come from the 4WD trim in the US). We can’t state the 2WD trim was safer than the 4WD trim despite the already-tiny difference in driver death rates because both vehicles have overlapping confidence bounds. We’ll dive further into what this means below, but for now, keep in mind that statistically, the 4WD and 2WD Sienna had indistinguishable driver death rates.

How can the Sienna and Odyssey be equally safe if the Odyssey had a (very slightly) lower driver death rate?

The reason the Sienna and Odyssey are equally safe despite the difference in death rates is because both have overlapping confidence bounds. The 95% confidence bounds are a way of expressing where we’d find the true driver death rate 95% of the time we searched for it by sampling drivers of each vehicle (e.g., if we sampled 1 million drivers of Odysseys for a year or 2 million Sienna drivers for 6 months, etc).

According to the IIHS’ math, the Odyssey’s true driver death rate would almost always fall between 1 and 15 while that of the 2WD Sienna would almost always fall between 2 and 16 (1 and 37 for the 4WD). There’s a chance (2-15, or 14, out of 1-16, or 16, or 87%) that the Odyssey and 2WD Sienna shared the same true driver death rate. Even expanding the comparison to all three vehicles, the overlap was 2-15, or 14, out of 1-37, or 37, or 38%, that all three trims of both vehicles shared exactly the same true driver death rate. It’s possible the Odyssey had the lowest true driver death rate. It’s just as possible the Sienna did. There’s no way to know, though, or to statistically prove which vehicle was safer (or safest, if we include the 4WD trim). As a result, all three trims were effectively the same, safety-wise.

Is there a safety difference between the 2WD Sienna and 4WD Sienna?

As noted above, both trims were statistically equal. Although there’s a long-running myth of 4WD being safer than 2WD (which I mention in the CR-V / Pilot comparisons), the statistics don’t show a difference between most vehicles that include both trims when considering actual driving safety as measured by your likelihood of dying while driving. 4WD helps you start when you might get stuck with 2WD (e.g., in heavy snow). It doesn’t increase safety in steering, braking, or stopping. Every four-wheeled vehicle you’ll find on the road has two wheel steering and four wheel braking.

Are my loved ones–my spouse, my children, my family–just as safe in a Sienna as they are in an Odyssey?

Yes, per the IIHS’ calculations. The same essential safety features (i.e., good frontal and side crash scores, side airbags with head protection, and ESC) are present, and these would likely extend the same safety benefits to passengers as they did to drivers. If your family is lucky enough to travel in either vehicle, your primary safety differences won’t involve the vehicles–which are statistically equal in safety–but how and where you drive them.

What is most important for keeping my family safe in a minivan–or a car or SUV?

If you take away one thing from this article, take away the core point that your family’s safety doesn’t primarily depend on the vehicle you’re driving. The most important things you can do to keep your loved ones alive in vehicles are to choose safe speeds, follow best practices with car seats,Ā  and choose safe roads. Following these guidelines will up your family’s chances of both avoiding and surviving road trauma more than any benefits you’d get from choosing the “right” vehicle.

If you find my information on best practices in car and car seat safety helpful, you can do your shopping through this Amazon link. Canadians can shop here for Canadian purchases. Have a question or want to discuss best practices? Join us in the forums!